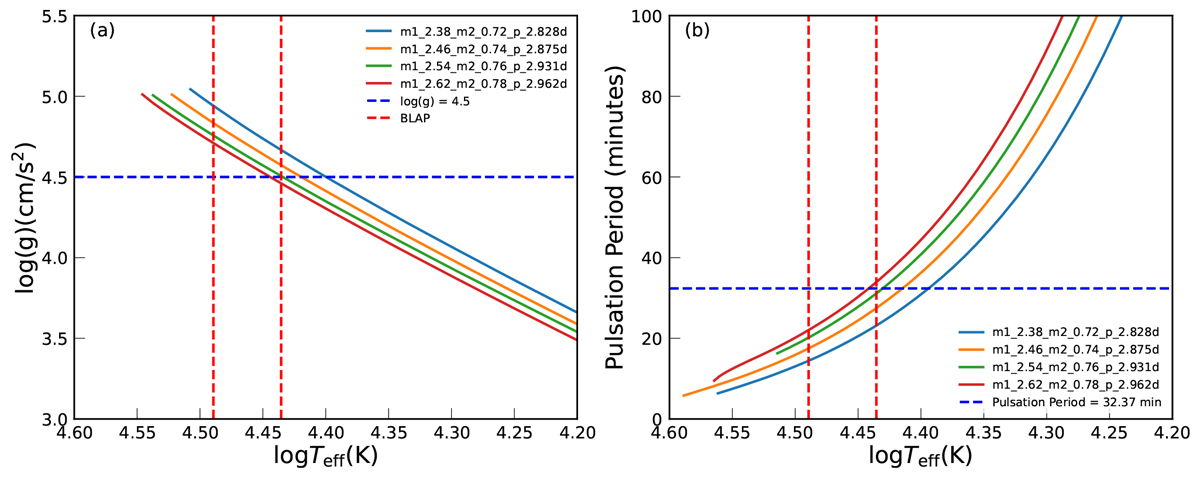
Fig. 7.
Download original image
Diagnostic diagrams showing the evolution of stellar parameters for four binary models selected based on their final orbital period. Panel a: Relationship between effective temperature and surface gravity, with horizontal and vertical dashed lines indicating the observational constraints for BLAP (red: log Teff range; dark blue: log(g/cm s−2) = 4.5). Panel b: Correlation between effective temperature and pulsation period. The horizontal and vertical dashed lines mark the observed BLAP temperature range (red) and the target pulsation period of 32.27 minutes (dark blue), respectively.
Current usage metrics show cumulative count of Article Views (full-text article views including HTML views, PDF and ePub downloads, according to the available data) and Abstracts Views on Vision4Press platform.
Data correspond to usage on the plateform after 2015. The current usage metrics is available 48-96 hours after online publication and is updated daily on week days.
Initial download of the metrics may take a while.