Open Access
Fig. 2
Download original image
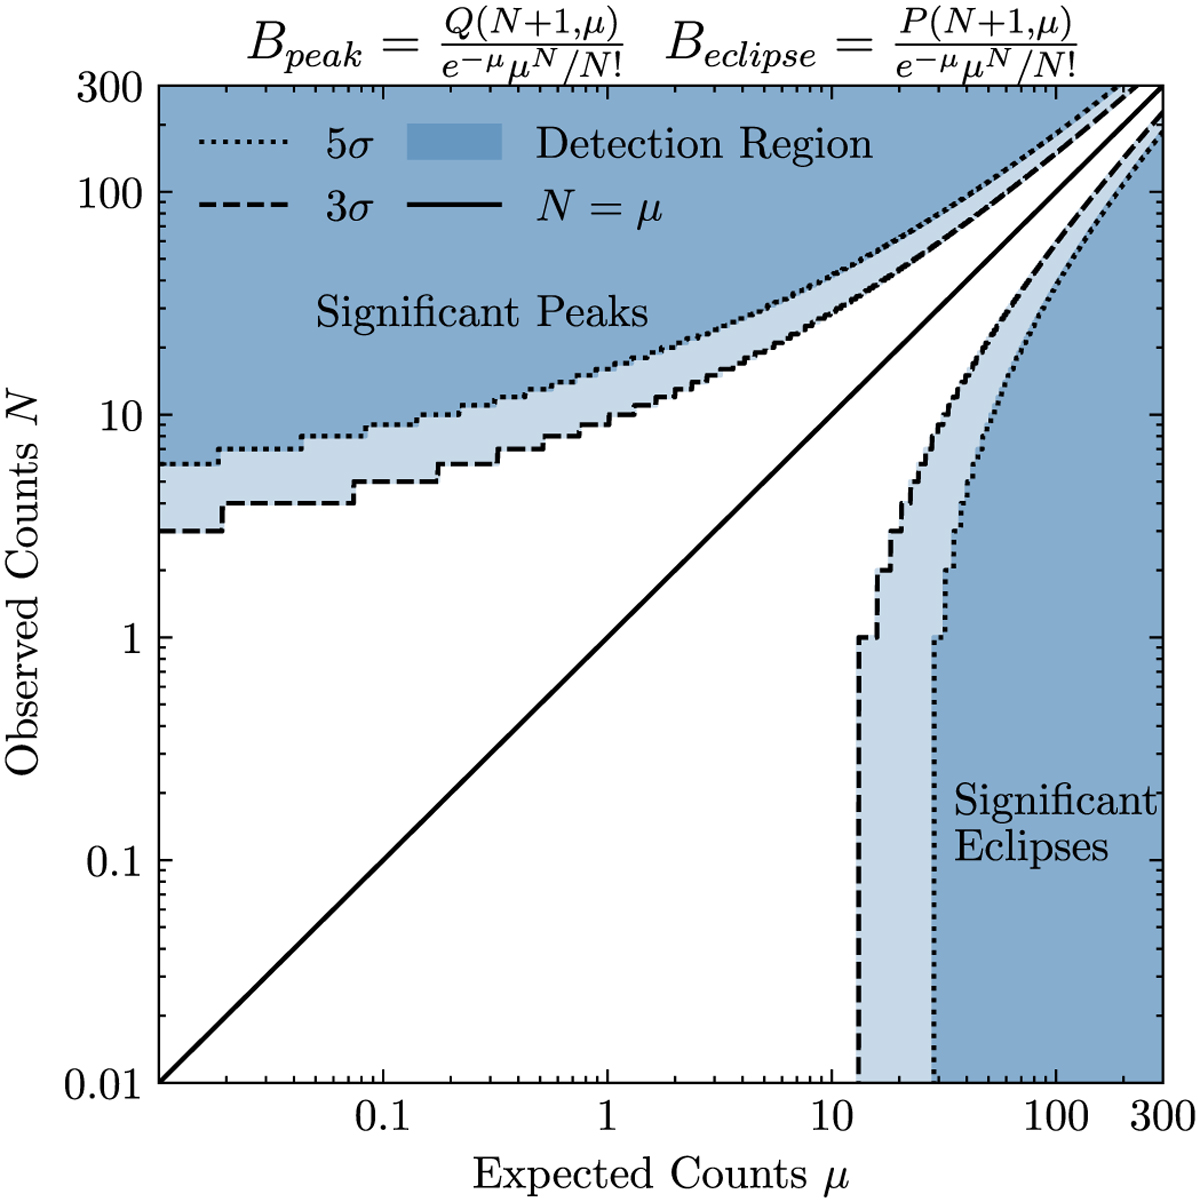
Observed counts (N) against expected counts (μ) shown in the range 0.01–300 counts. The significant detection regions for peaks and eclipses are denoted by the dashed (3σ) and dotted (5σ) lines and are shaded in blue. These thresholds correspond to the sigma equivalent thresholds (see text).
Current usage metrics show cumulative count of Article Views (full-text article views including HTML views, PDF and ePub downloads, according to the available data) and Abstracts Views on Vision4Press platform.
Data correspond to usage on the plateform after 2015. The current usage metrics is available 48-96 hours after online publication and is updated daily on week days.
Initial download of the metrics may take a while.