Fig. B.4
Download original image
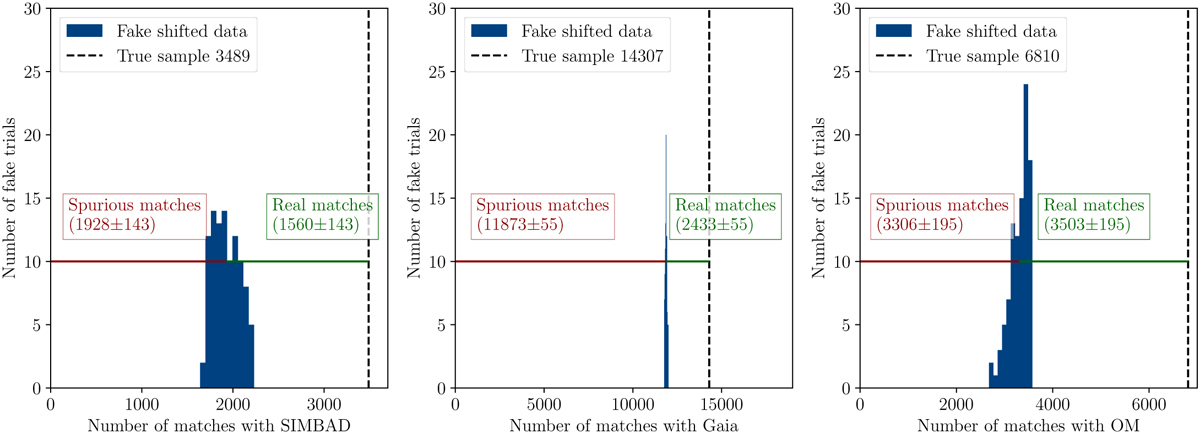
Estimation of the fraction of spurious associations between new EXOD sources (not in DR14) and the SIMBAD, Gaia, and OM catalogues. In each panel, the blue histogram corresponds to the results of the Monte Carlo shifted cross-match method, and the black dotted line to the number of associations in the true dataset. The red and green lines show the numbers of spurious matches and real matches, respectively.
Current usage metrics show cumulative count of Article Views (full-text article views including HTML views, PDF and ePub downloads, according to the available data) and Abstracts Views on Vision4Press platform.
Data correspond to usage on the plateform after 2015. The current usage metrics is available 48-96 hours after online publication and is updated daily on week days.
Initial download of the metrics may take a while.