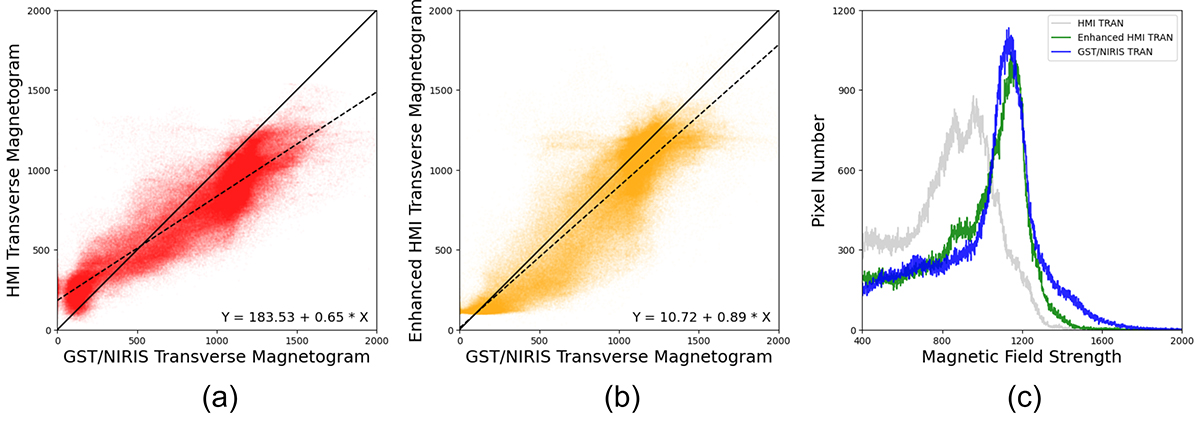
Fig. 5.
Download original image
Scatterplots and histograms obtained when the HMI transverse magnetogram of AR 12371 at 16:48:00 UT on 22 June 2015 is super-resolved. (a) Scatterplot of the HMI transverse magnetogram vs. the corresponding GST/NIRIS transverse magnetogram. (b) Scatterplot of the enhanced HMI transverse magnetogram vs. the corresponding GST/NIRIS transverse magnetogram. (c) Histograms of the three magnetograms mentioned above.
Current usage metrics show cumulative count of Article Views (full-text article views including HTML views, PDF and ePub downloads, according to the available data) and Abstracts Views on Vision4Press platform.
Data correspond to usage on the plateform after 2015. The current usage metrics is available 48-96 hours after online publication and is updated daily on week days.
Initial download of the metrics may take a while.