Fig. 3
Download original image
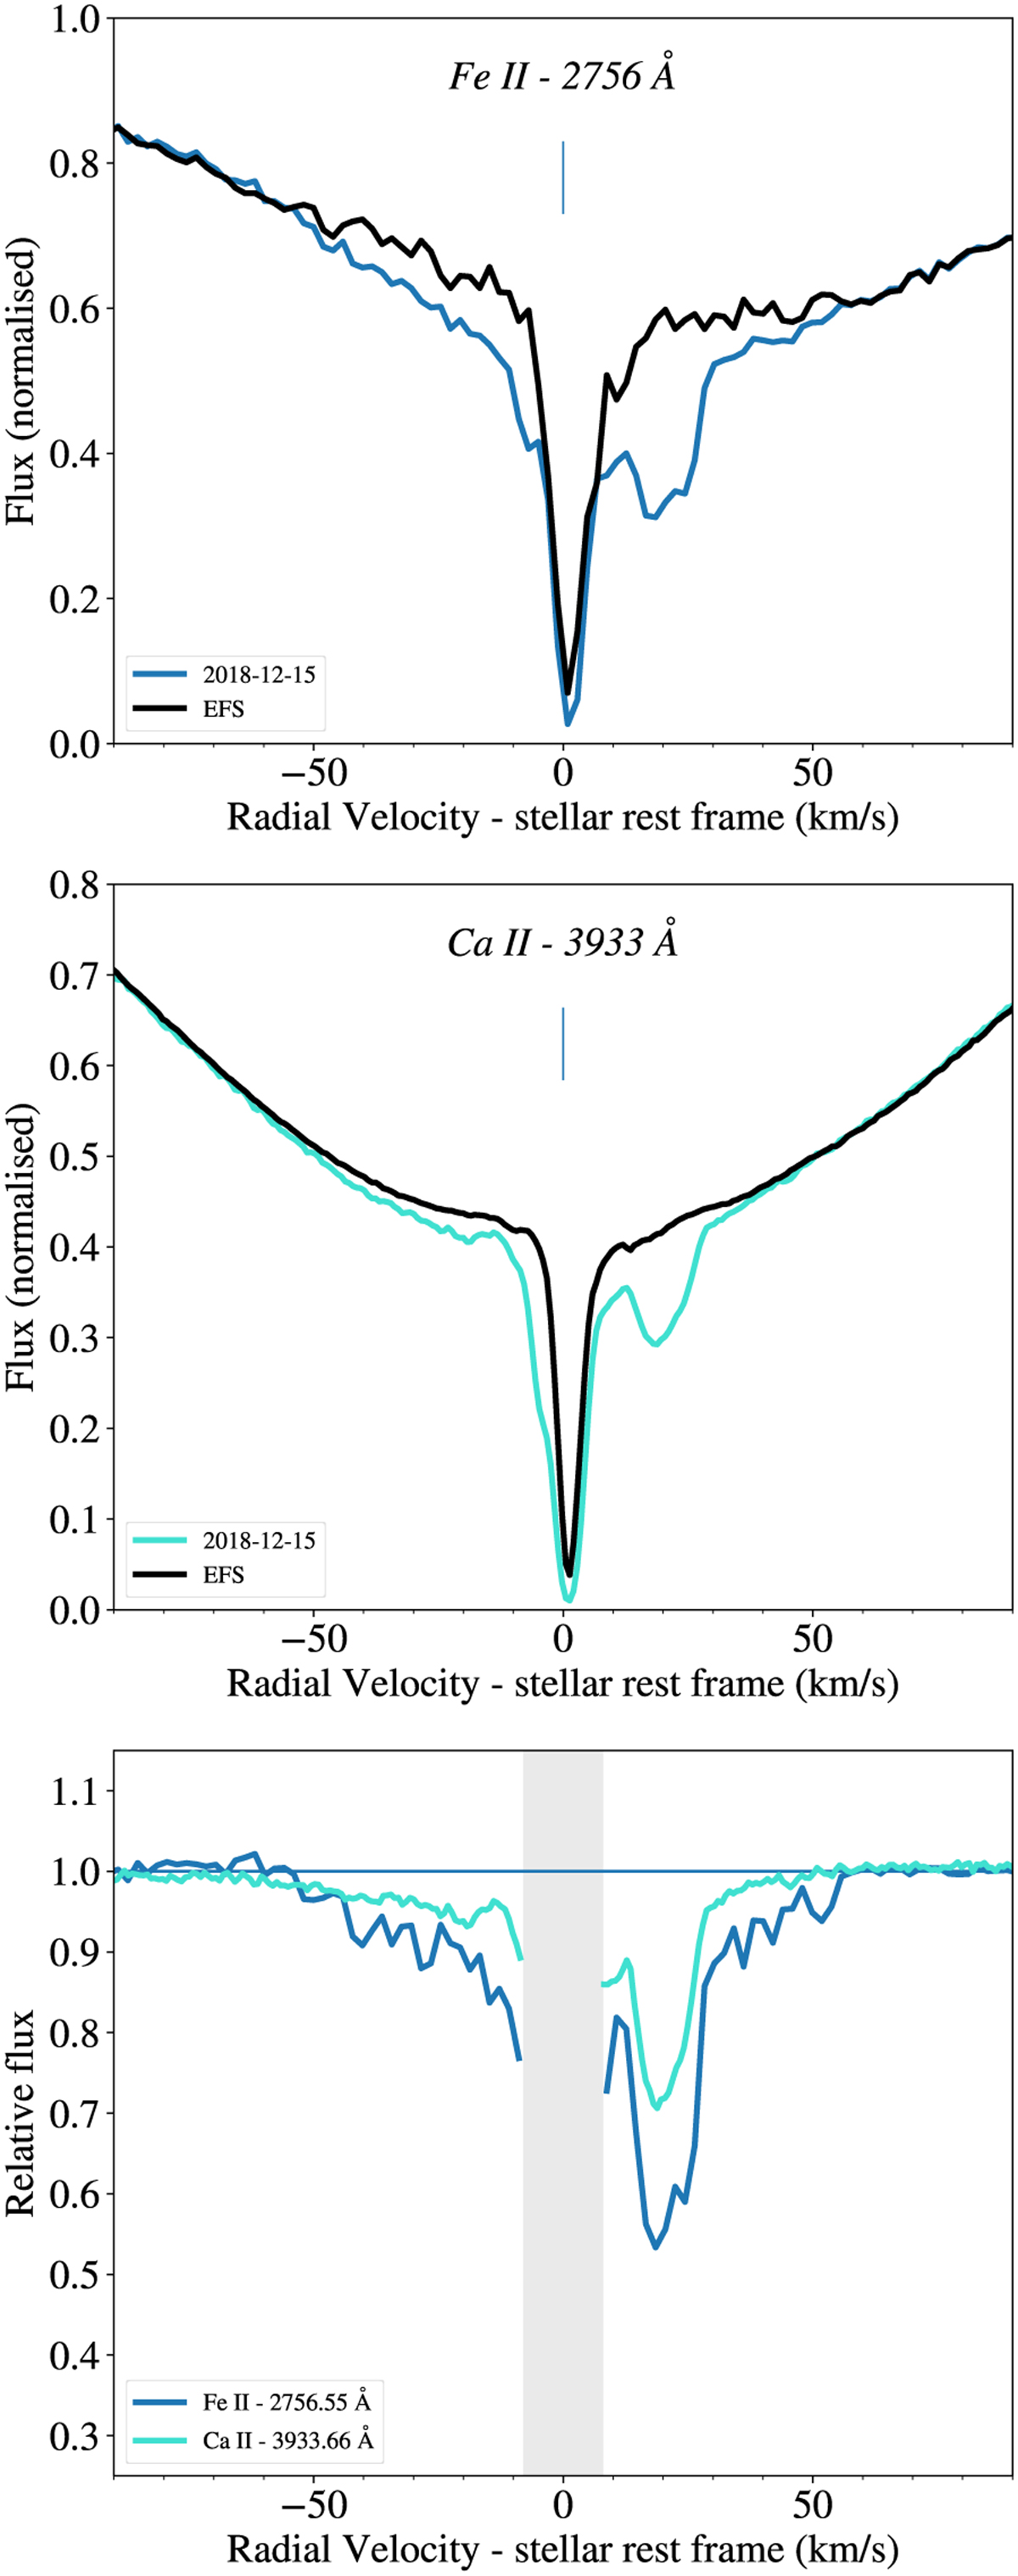
Cometary absorption observed in Fe II (top) and Ca II lines (middle, one hour later) on December 15, 2018. The EFS is plotted with a thick black line. The comparison of the absorption after division by the reference spectrum is given in the bottom panel (the region near the circumstellar line was removed due to a poorer EFS determination in Fe II lines).
Current usage metrics show cumulative count of Article Views (full-text article views including HTML views, PDF and ePub downloads, according to the available data) and Abstracts Views on Vision4Press platform.
Data correspond to usage on the plateform after 2015. The current usage metrics is available 48-96 hours after online publication and is updated daily on week days.
Initial download of the metrics may take a while.