Open Access
Fig. 14
Download original image
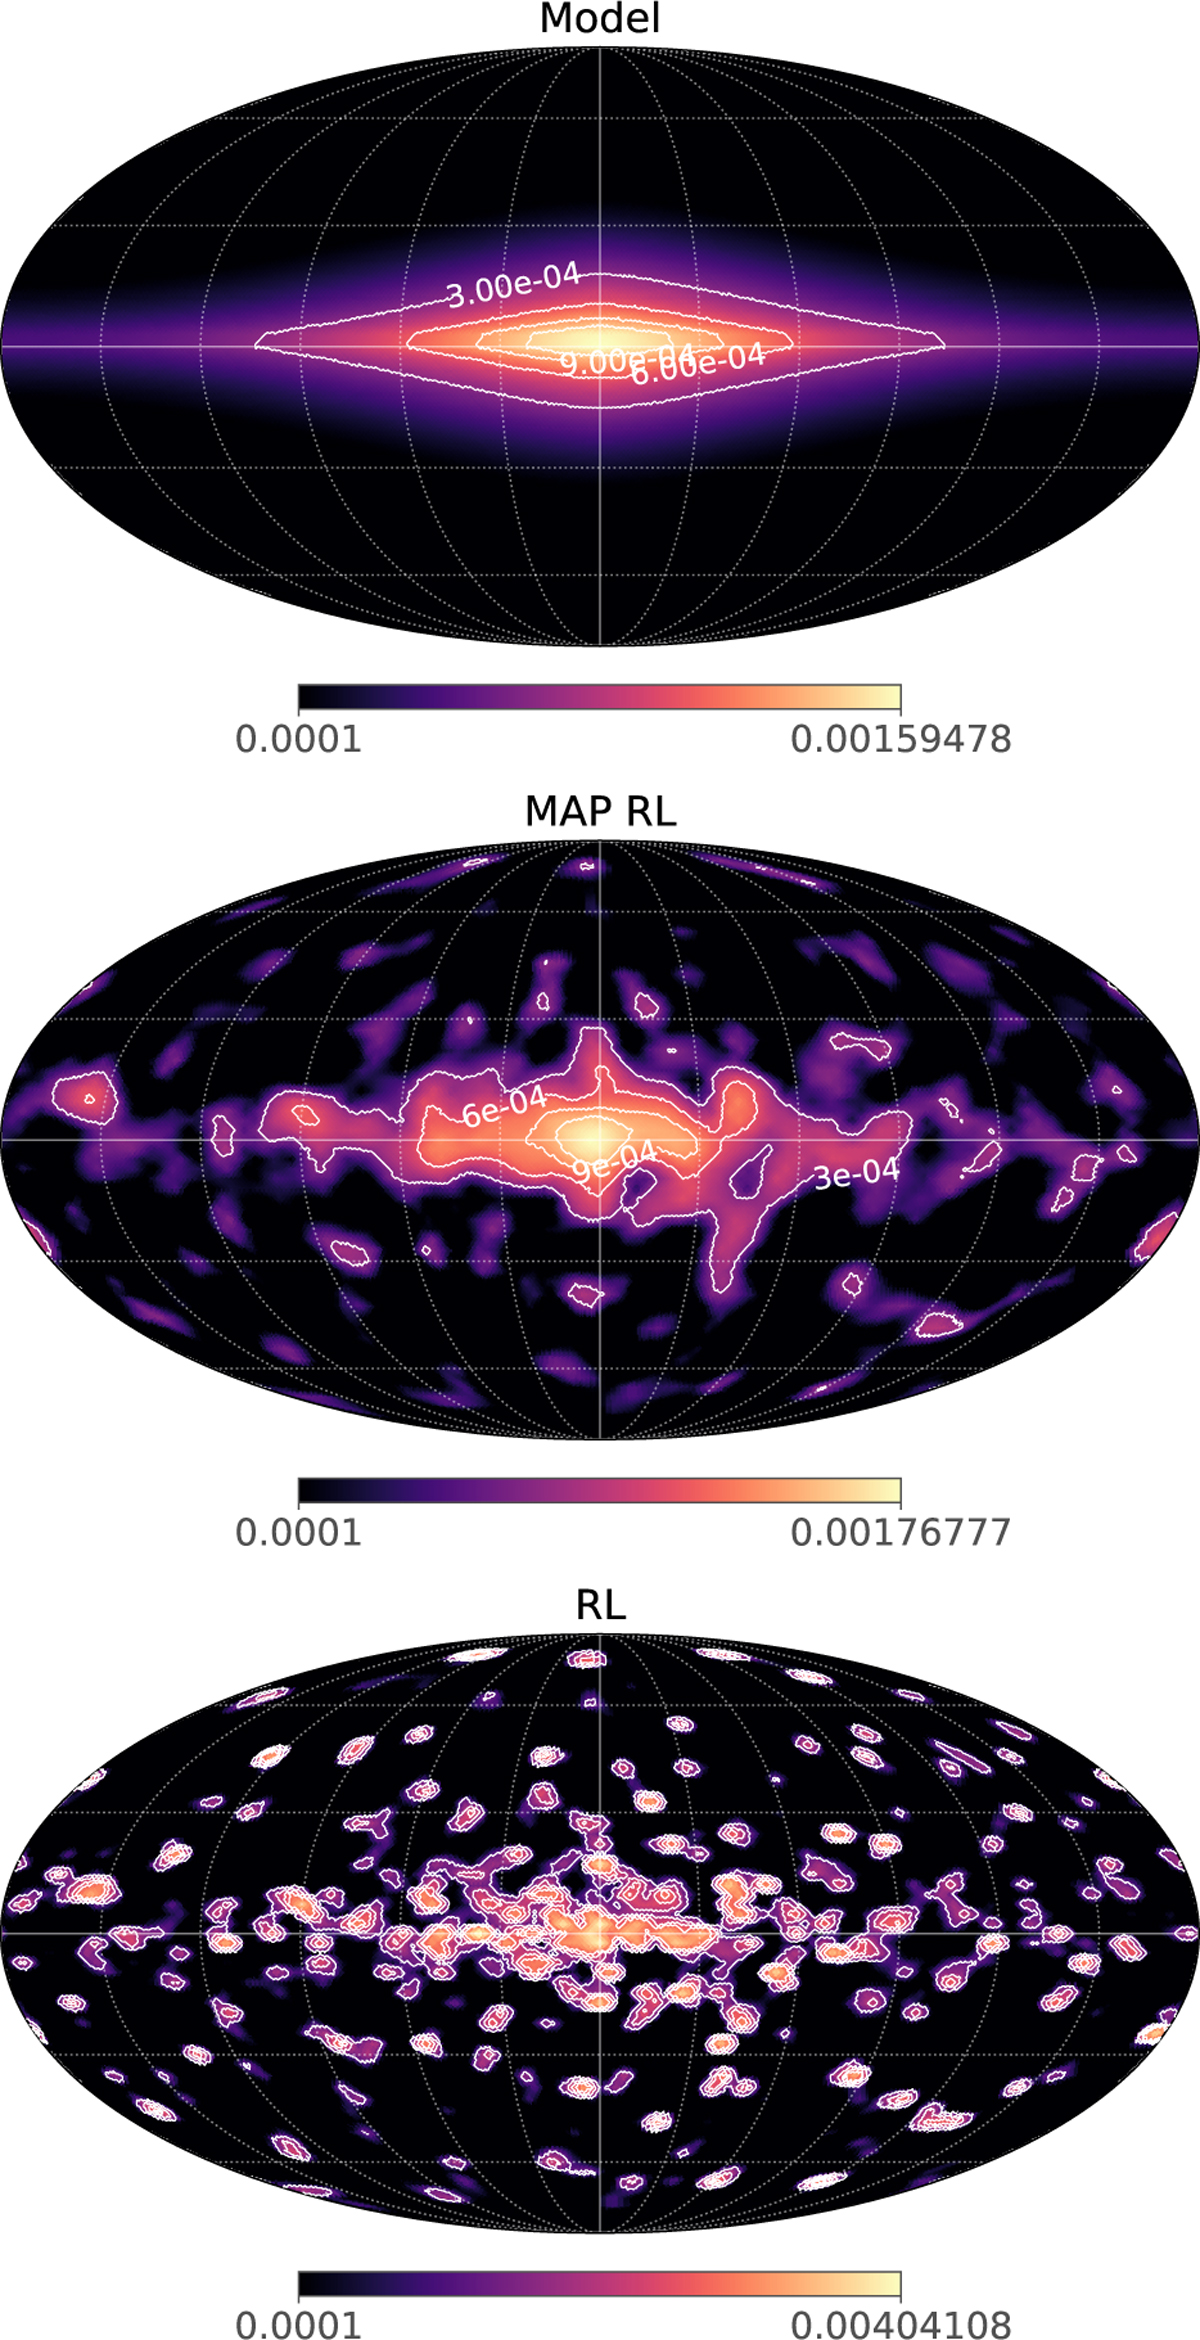
Comparison between the reconstructed images obtained with different methods. The images are in the units of ph/cm2/s/sr. The top shows the injected model for the 26Al map, while the middle and bottom show the reconstructed image with the proposed algorithm and the conventional RL algorithm, respectively.
Current usage metrics show cumulative count of Article Views (full-text article views including HTML views, PDF and ePub downloads, according to the available data) and Abstracts Views on Vision4Press platform.
Data correspond to usage on the plateform after 2015. The current usage metrics is available 48-96 hours after online publication and is updated daily on week days.
Initial download of the metrics may take a while.