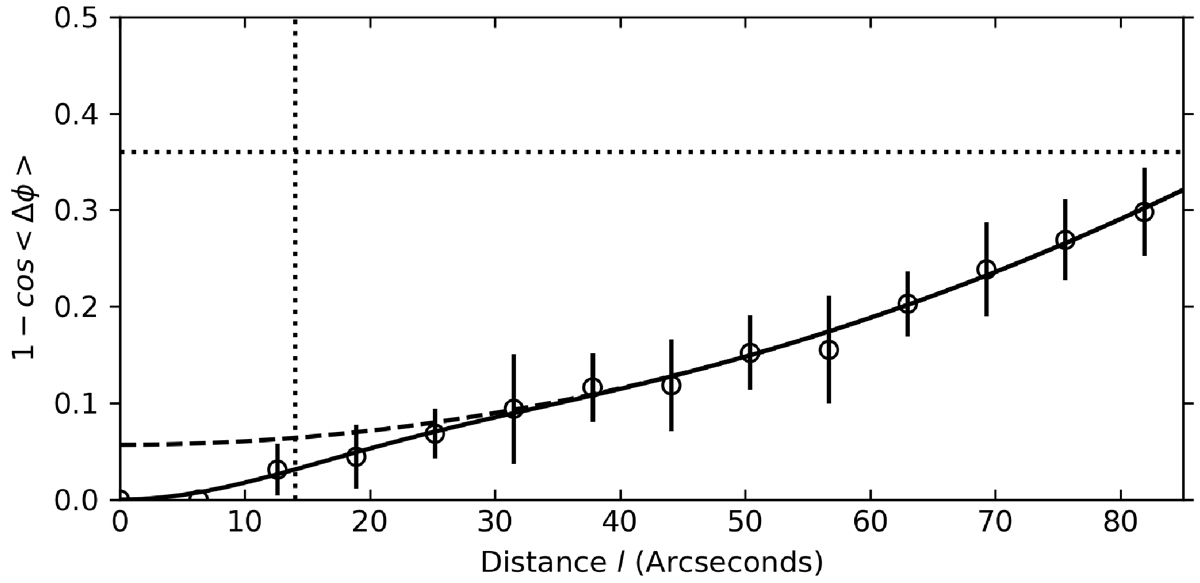
Fig. B.1.
Download original image
ADF of G31 hub-filament system defined by the rectangular region defined in Fig. A.1. Open circles represent the observed data, with the error bars indicating the dispersion. The best fit is shown by a solid line, and the dashed line represents the ordered component (a2′l2) of the best fit. The dotted vertical line and the horizontal lines, respectively, represent the beam size (12.6″) and the expected value for random B field ((1−cos〈Δϕ〉 = 0.36, Liu et al. 2022b).
Current usage metrics show cumulative count of Article Views (full-text article views including HTML views, PDF and ePub downloads, according to the available data) and Abstracts Views on Vision4Press platform.
Data correspond to usage on the plateform after 2015. The current usage metrics is available 48-96 hours after online publication and is updated daily on week days.
Initial download of the metrics may take a while.