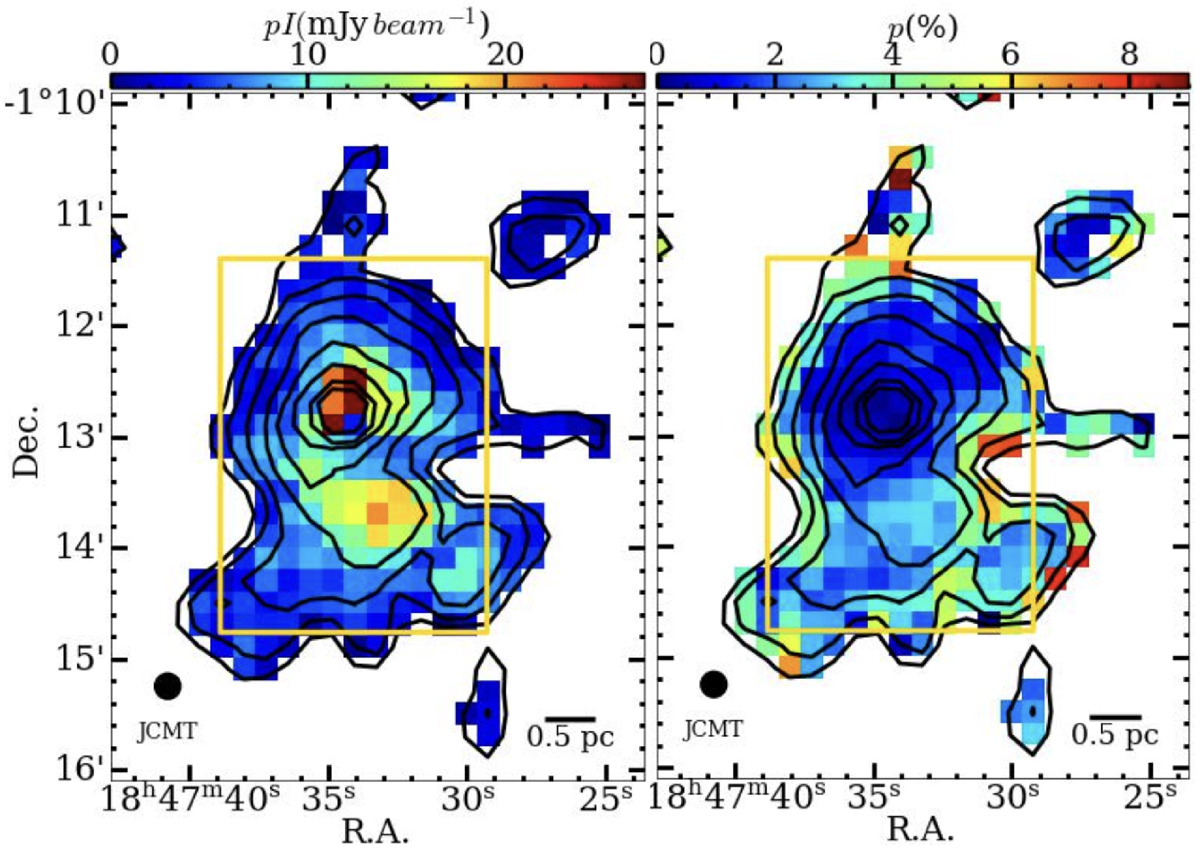
Fig. A.1.
Download original image
Left: JCMT POL-2 850 μm Stokes I intensity contours overlaid on the debiased polarized fraction, p. The contours levels are [10, 20, 40, 60, 80, 100, 200, 400]× σ, where σ = 4 mJy beam−1. Right: Same as the left panel, with the colormap now showing the debiased polarized intensity, pI. The yellow box in the two panels indicate the region used for B-field strength estimates (see Appendix B for details). The JCMT beam is shown in the bottom left corner of each panel.
Current usage metrics show cumulative count of Article Views (full-text article views including HTML views, PDF and ePub downloads, according to the available data) and Abstracts Views on Vision4Press platform.
Data correspond to usage on the plateform after 2015. The current usage metrics is available 48-96 hours after online publication and is updated daily on week days.
Initial download of the metrics may take a while.