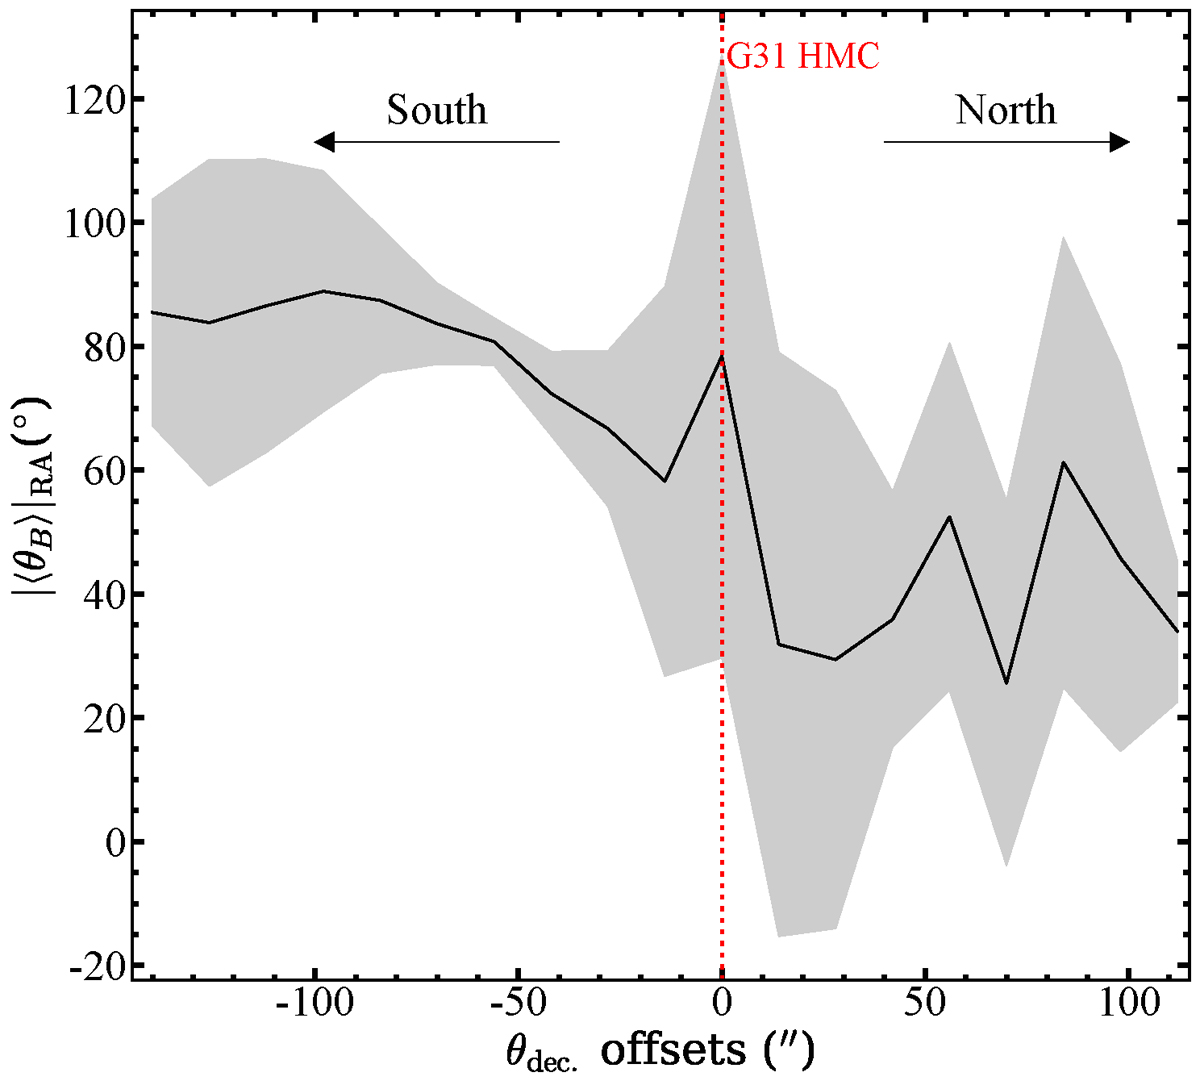
Fig. 3.
Download original image
Profile of the mean B-field orientation in the direction of the right ascension (|〈θB〉|RA) as a function of angular offsets along the direction of the declination (θdec) from the HMC position. The dotted red line represents the location of the HMC. Each average B-field orientation was computed by taking the angle average in the RA direction at each declination position. The shaded region represents the dispersion of the B-field orientation.
Current usage metrics show cumulative count of Article Views (full-text article views including HTML views, PDF and ePub downloads, according to the available data) and Abstracts Views on Vision4Press platform.
Data correspond to usage on the plateform after 2015. The current usage metrics is available 48-96 hours after online publication and is updated daily on week days.
Initial download of the metrics may take a while.