Fig. 2.
Download original image
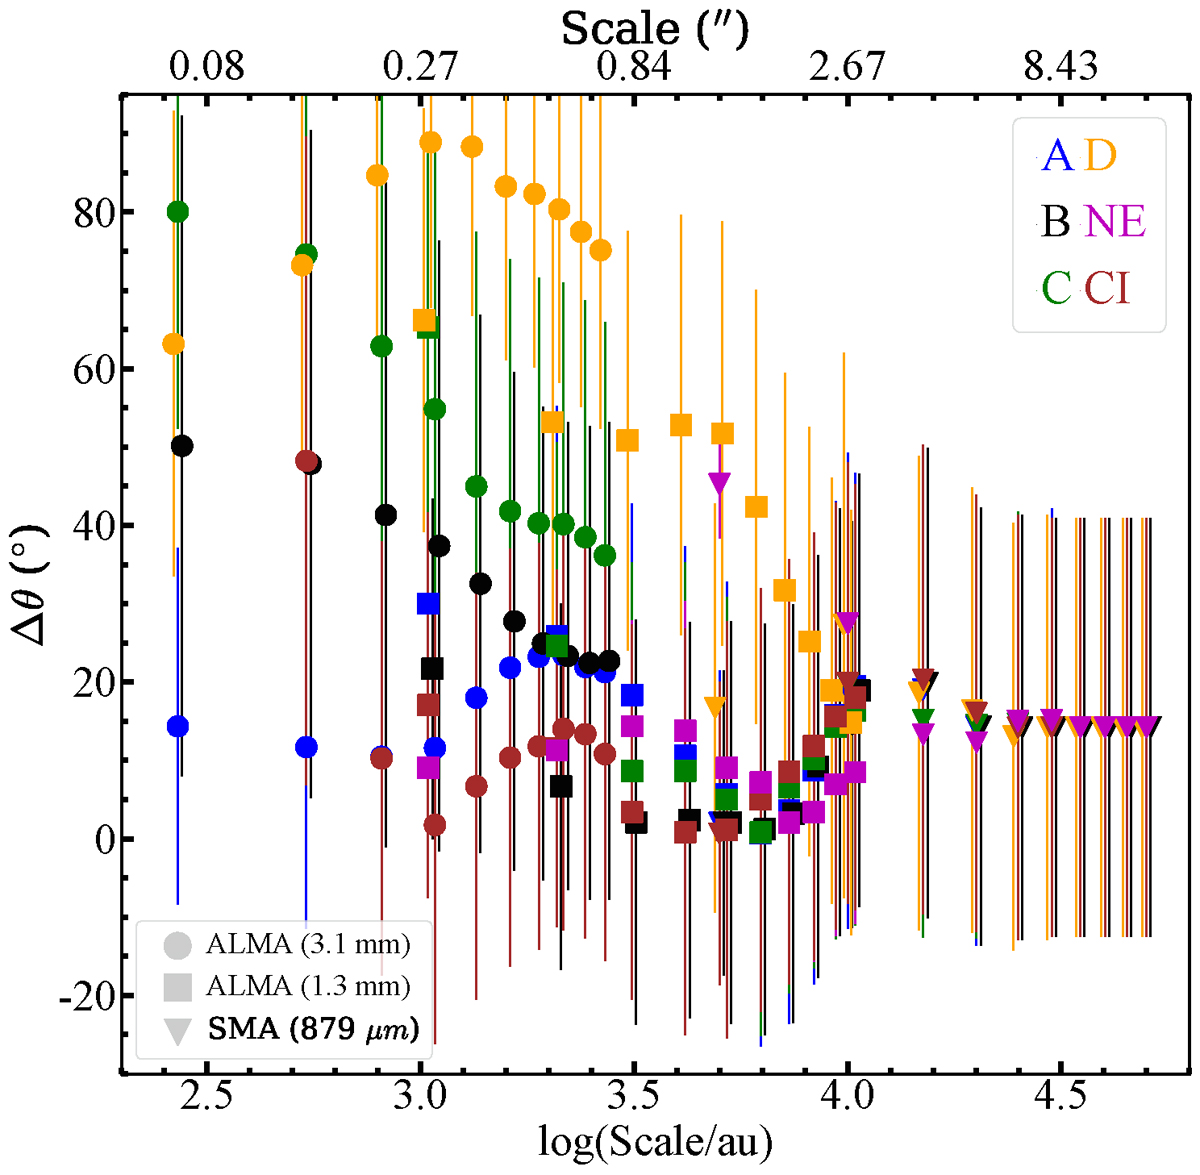
Angle difference (Δθ) and errors in Δθ between the cloud-scale B-field orientation and the mean B-field orientation toward the four embedded protostars (A-D), their center of intensity (CI), and the continuum source NE identified in Beltrán et al. (2021). The spatial scale is increased from the smallest aperture size defined by the diameter equivalent to the major axis of the synthesized beam of each interferometer up to ten times the original aperture diameter. Each symbol represents data obtained from different telescopes. Circle: ALMA 3.1 mm data with a synthesized beam of ![]() . Square: ALMA 1.3 mm data with a synthesized beam of
. Square: ALMA 1.3 mm data with a synthesized beam of ![]() (Beltrán et al. 2024). Triangle: SMA 879 μm data with a synthesized beam of
(Beltrán et al. 2024). Triangle: SMA 879 μm data with a synthesized beam of ![]() (Girart et al. 2009).
(Girart et al. 2009).
Current usage metrics show cumulative count of Article Views (full-text article views including HTML views, PDF and ePub downloads, according to the available data) and Abstracts Views on Vision4Press platform.
Data correspond to usage on the plateform after 2015. The current usage metrics is available 48-96 hours after online publication and is updated daily on week days.
Initial download of the metrics may take a while.