Fig. 1.
Download original image
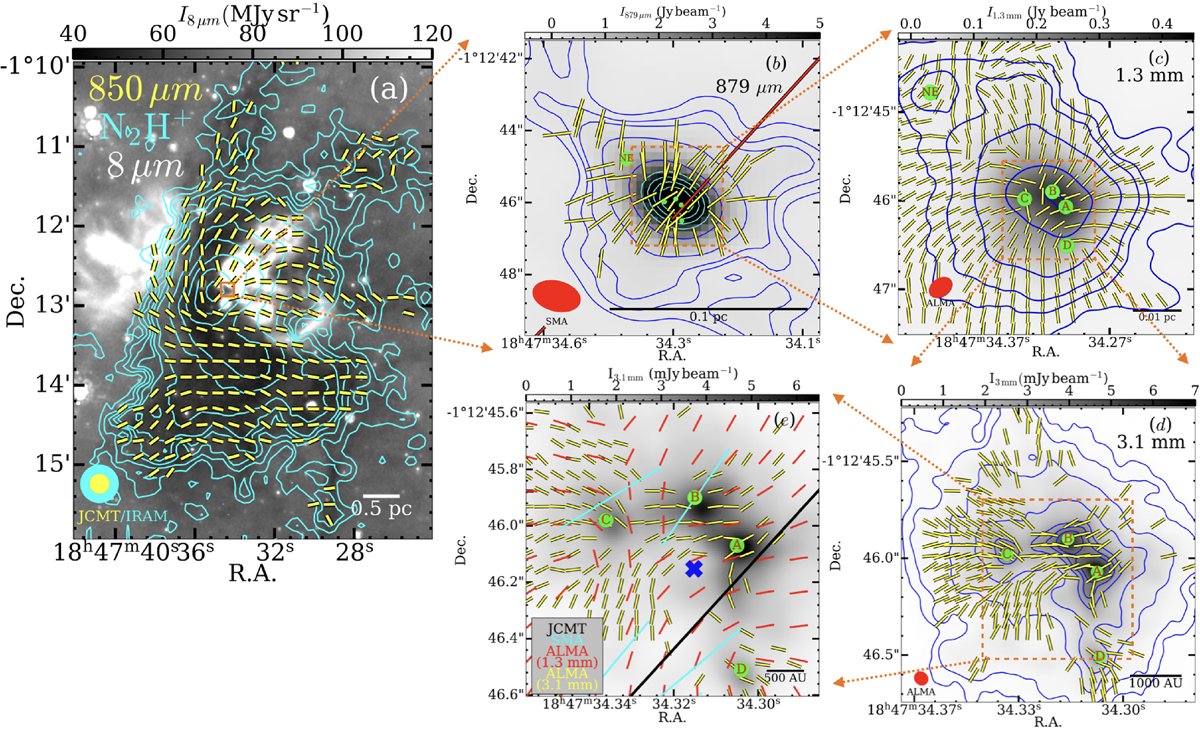
Multiscale view of the B field toward the massive star-forming region G31.41+0.31. Panel (a): B-field segments (yellow) observed with the JCMT POL-2 (this work) with a primary beam FWHM of 12.6″ (Mairs et al. 2021) plotted in steps of 1 pixel with a scale of 12″ overlaid on the Spitzer GLIMPSE 8 μm image and IRAM-30m N2H+ integrated-intensity map (cyan contours) from Beltrán et al. (2022b). Panel (b): B-field segments (yellow) observed with SMA plotted with a step of 1 pixel and JCMT POL-2 (red) overlaid on the Stokes I (blue and cyan contours) at 879 μm observed with the SMA and a synthesized beam of ![]() by Girart et al. (2009). Panel (c): B-field segments (yellow) plotted with a pixel step of 7 pixels overlaid on the Stokes I blue contours) at 1.3 mm observed with ALMA and a synthesized beam of
by Girart et al. (2009). Panel (c): B-field segments (yellow) plotted with a pixel step of 7 pixels overlaid on the Stokes I blue contours) at 1.3 mm observed with ALMA and a synthesized beam of ![]() by Beltrán et al. (2009). Panel (d): B-field segments (yellow) plotted with a pixel step of 7 pixels overlaid on the Stokes I (blue contours) at 3.1 mm with ALMA and a synthesized beam of
by Beltrán et al. (2009). Panel (d): B-field segments (yellow) plotted with a pixel step of 7 pixels overlaid on the Stokes I (blue contours) at 3.1 mm with ALMA and a synthesized beam of ![]() (Beltrán et al. 2024). The (synthesized) beam of the different instruments is shown in the bottom left corner of each panel. Panel (e): B-field segments at different wavelengths and resolutions (see legend) overlaid on the 3.1 mm Stokes I intensity map (gray scale), same as panel (d). The blue cross indicates the center of intensity position. In panels b to d, A–D represent the four continuum protostars embedded in the HMC, and NE represents the continuum core, which is located northeast of the HMC (Beltrán et al. 2021).
(Beltrán et al. 2024). The (synthesized) beam of the different instruments is shown in the bottom left corner of each panel. Panel (e): B-field segments at different wavelengths and resolutions (see legend) overlaid on the 3.1 mm Stokes I intensity map (gray scale), same as panel (d). The blue cross indicates the center of intensity position. In panels b to d, A–D represent the four continuum protostars embedded in the HMC, and NE represents the continuum core, which is located northeast of the HMC (Beltrán et al. 2021).
Current usage metrics show cumulative count of Article Views (full-text article views including HTML views, PDF and ePub downloads, according to the available data) and Abstracts Views on Vision4Press platform.
Data correspond to usage on the plateform after 2015. The current usage metrics is available 48-96 hours after online publication and is updated daily on week days.
Initial download of the metrics may take a while.