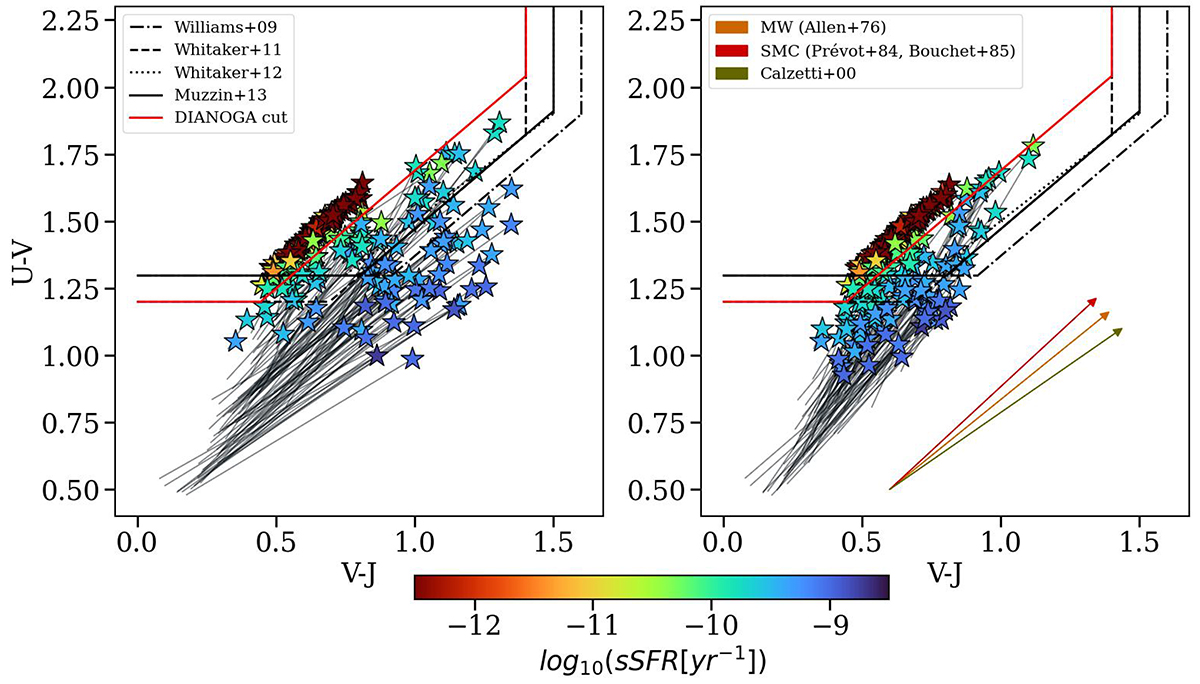
Fig. 14.
Download original image
Simulated UVJ diagrams for galaxies within seven massive halos in DIANOGA PC regions at z = 2.2, within a 700 kpc aperture, produced with SKIRT-9. Intrinsic colors are connected to attenuated colors by gray arrows that end with star symbols color coded according to the sSFRs of galaxies. The left panel shows the diagram obtained by tracing dust in the diffuse ISM through a fixed dust-to-metal ratio. The right panel shows the diagram produced with the model for MCs described in Sect. 2.3. Typical cuts adopted in UVJ diagrams to separate quenched and star-forming galaxies (Williams et al. 2009; Whitaker et al. 2011, 2012; Muzzin et al. 2013) are shown as black lines, while the red line defines a custom-defined boundary to separate these populations in the DIANOGA simulations. The colored arrows show the reddening vectors for typical attenuation laws (Allen 1976; Prevot et al. 1984; Bouchet et al. 1985; Calzetti et al. 2000).
Current usage metrics show cumulative count of Article Views (full-text article views including HTML views, PDF and ePub downloads, according to the available data) and Abstracts Views on Vision4Press platform.
Data correspond to usage on the plateform after 2015. The current usage metrics is available 48-96 hours after online publication and is updated daily on week days.
Initial download of the metrics may take a while.