Fig. 10.
Download original image
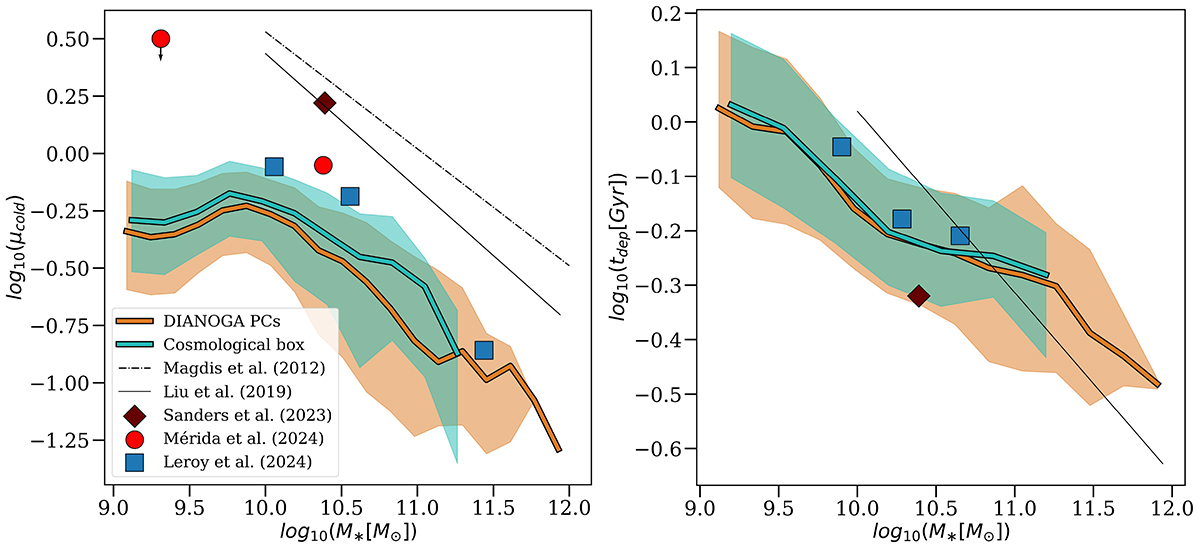
Cold gas fractions (left panel) and depletion times (right panel) in star-forming galaxies in the DIANOGA PCs (orange) and in the cosmological box (green) as a function of stellar masses. Solid lines (shaded regions) show median values (16th–84th percentile ranges, respectively). For comparison, we show observations at z ∼ 1.5 − 3 from Magdis et al. (2012), Liu et al. (2019), Sanders et al. (2023), Mérida et al. (2024) and Leroy et al. (2024).
Current usage metrics show cumulative count of Article Views (full-text article views including HTML views, PDF and ePub downloads, according to the available data) and Abstracts Views on Vision4Press platform.
Data correspond to usage on the plateform after 2015. The current usage metrics is available 48-96 hours after online publication and is updated daily on week days.
Initial download of the metrics may take a while.