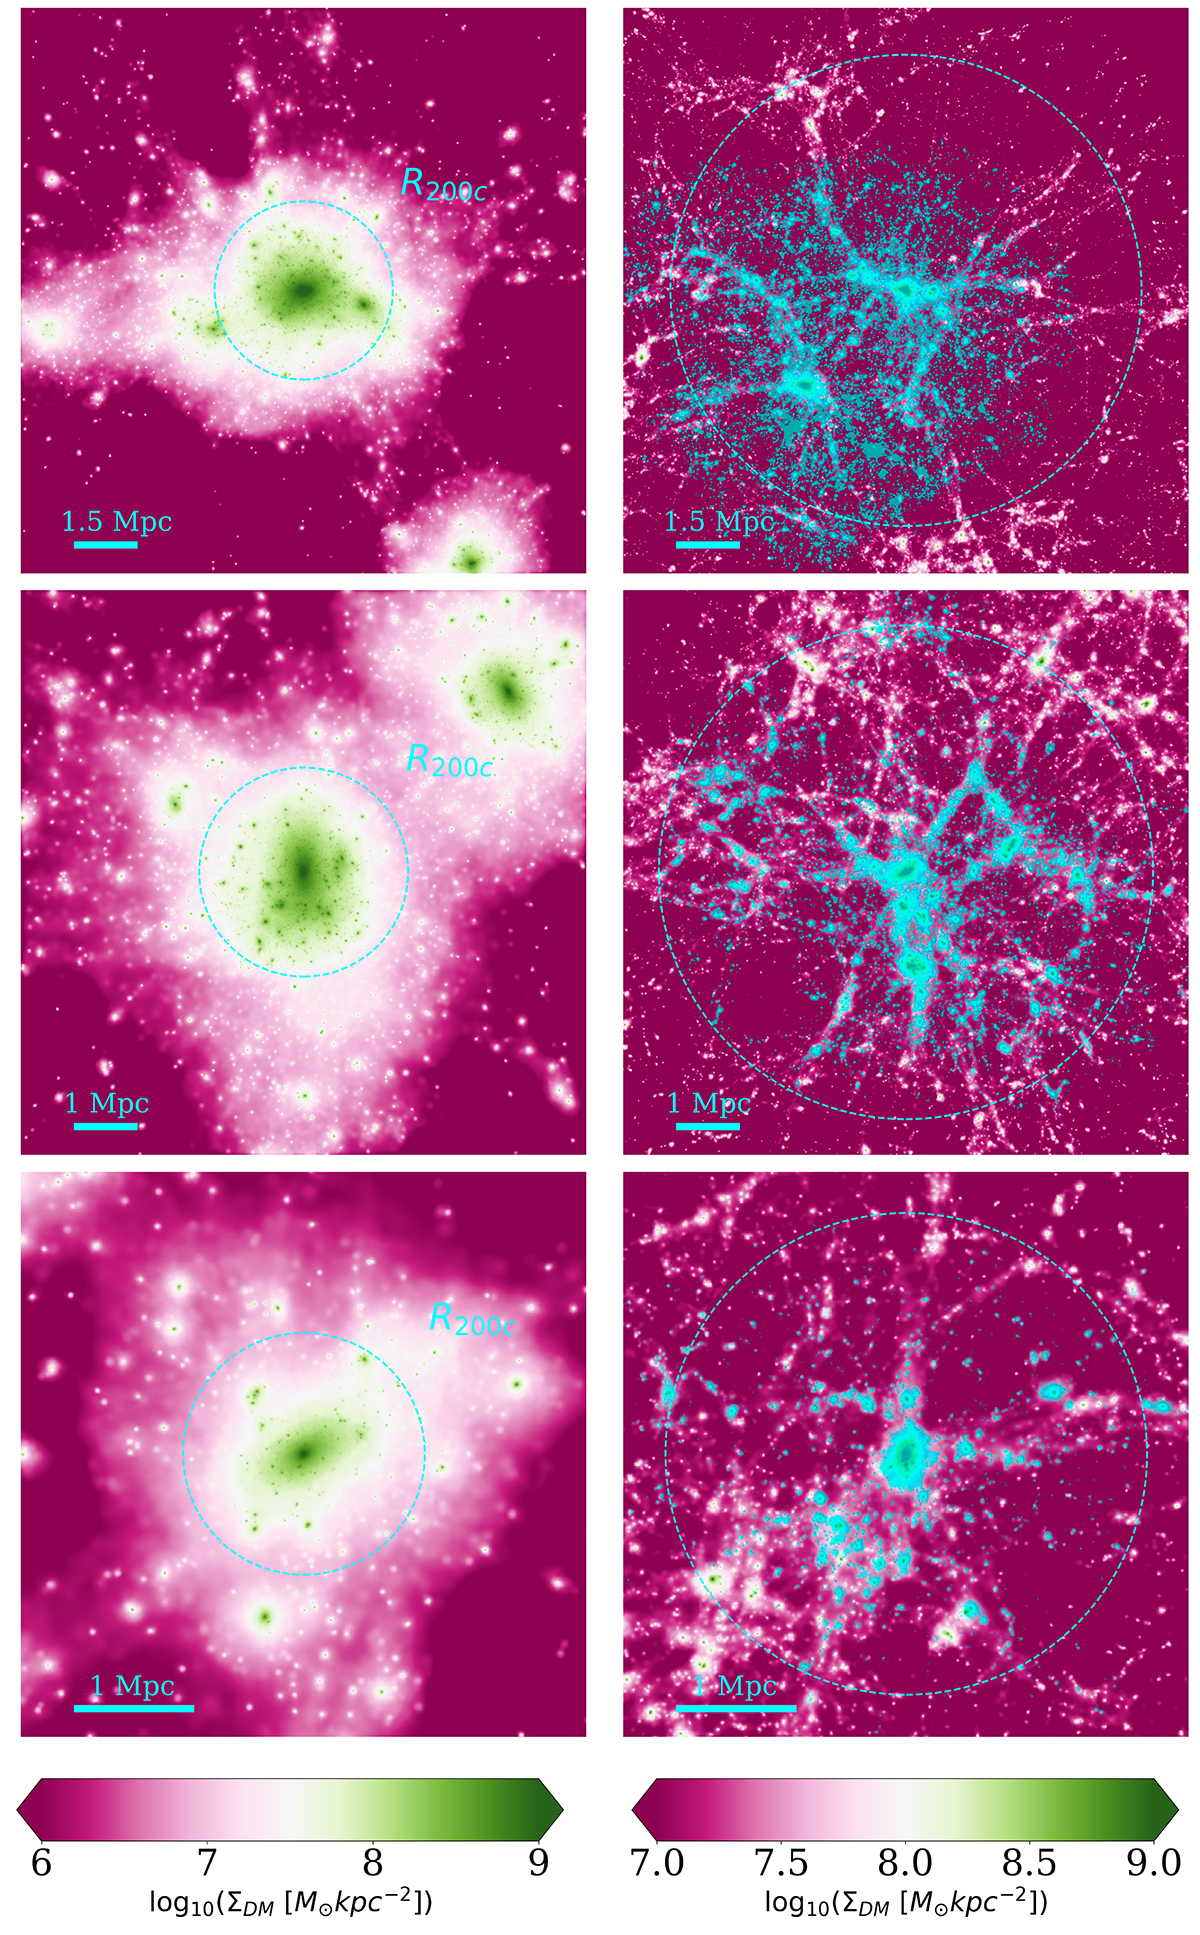
Fig. 1.
Download original image
Projected DM density maps of three simulated clusters at z = 0 (left column), with total masses M200c = 2 × 10¹⁵ M⊙ (top), 9 × 10¹⁴ M⊙ (middle), and 2 × 10¹⁴ M⊙ (bottom), and their z = 2.2 progenitors (right column). The cyan circle at z = 0 traces the R200c radius of each cluster, the one at z = 2.2 defines the PC region as defined in the text. DM particles at z = 2.2 that collapse within the R200c radius by z = 0 are plotted in cyan. Densities are computed in pixels of size 15 kpc in the top panel and 10 kpc in the middle and bottom panels.
Current usage metrics show cumulative count of Article Views (full-text article views including HTML views, PDF and ePub downloads, according to the available data) and Abstracts Views on Vision4Press platform.
Data correspond to usage on the plateform after 2015. The current usage metrics is available 48-96 hours after online publication and is updated daily on week days.
Initial download of the metrics may take a while.