Fig. 6.
Download original image
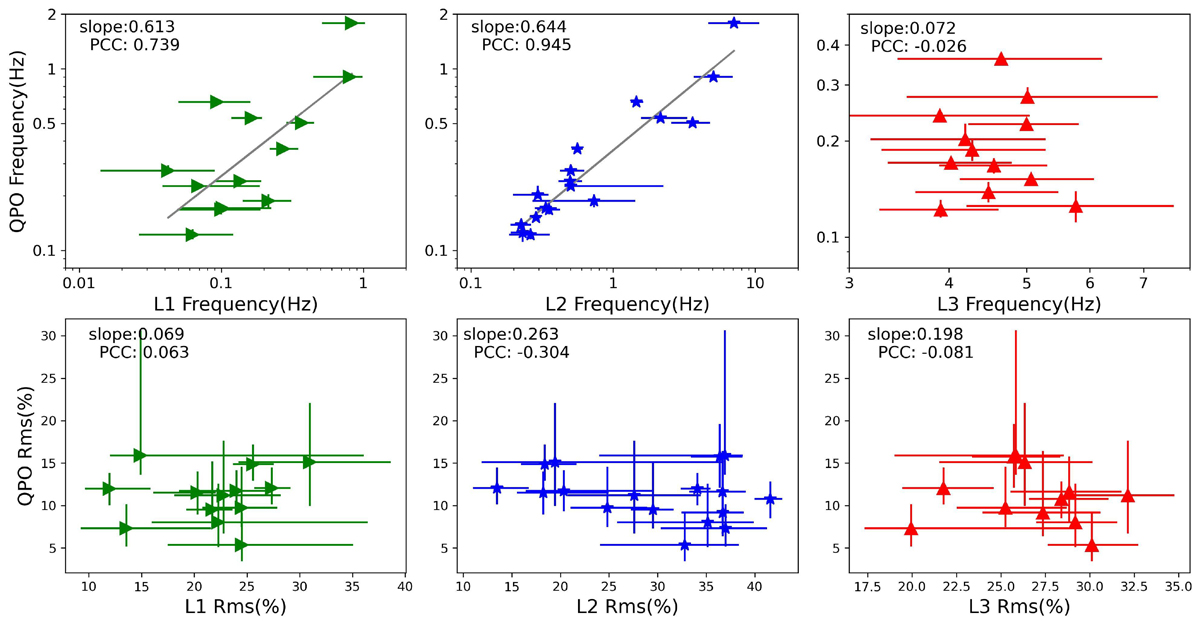
Relation between the QPO components and the L1, L2, and L3 components. The frequency relation has shown in the top row of panels, while the rms relation has shown in the bottom row of panels. The green right-triangles, blue stars, and red up-triangles represents the L1, L2, and L3 components. The slope of linear regression curve and Pearson correlation coefficients (PCCs) have been shown in the panels. The solid lines are the linear regression curves for QPO frequencies versus L1 and L2 frequencies in the logarithmic axis.
Current usage metrics show cumulative count of Article Views (full-text article views including HTML views, PDF and ePub downloads, according to the available data) and Abstracts Views on Vision4Press platform.
Data correspond to usage on the plateform after 2015. The current usage metrics is available 48-96 hours after online publication and is updated daily on week days.
Initial download of the metrics may take a while.