Fig. 5.
Download original image
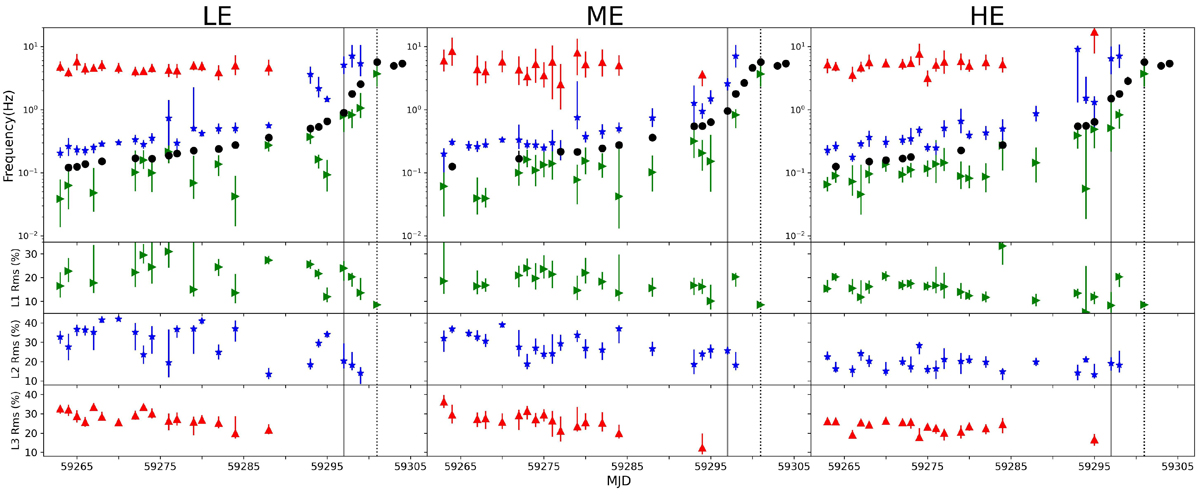
Evolution of the frequency and fractional rms of four components with time for Insight-HXMT LE (1–10 keV, left column), ME (10–30 keV, middle column), and HE (28–100 keV, right column) data. In the top row of panels, the evolution of the frequency is shown with black points for the QPO component and green right-triangles, blue stars, and red up-triangles for the L1, L2, and L3 components, respectively. In the three rows of panels below, the evolution of fractional rms of the L1, L2, and L3 components with time has shown.
Current usage metrics show cumulative count of Article Views (full-text article views including HTML views, PDF and ePub downloads, according to the available data) and Abstracts Views on Vision4Press platform.
Data correspond to usage on the plateform after 2015. The current usage metrics is available 48-96 hours after online publication and is updated daily on week days.
Initial download of the metrics may take a while.