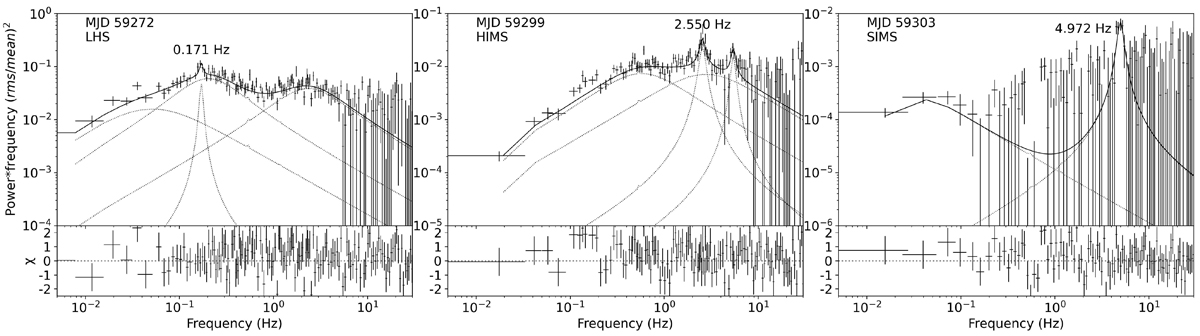
Fig. 4.
Download original image
Representative power density spectra for the different outburst stages using the Insight-HXMT LE data (1–10 keV). The solid lines show the best fit with a multiple-Lorentzian function (dotted lines). The MJD, the corresponding outburst stage and the QPO fundamental frequency are shown for each panel. The left, middle, and right panel show the PDS in the LHS, the HIMS, and the SIMS, respectively.
Current usage metrics show cumulative count of Article Views (full-text article views including HTML views, PDF and ePub downloads, according to the available data) and Abstracts Views on Vision4Press platform.
Data correspond to usage on the plateform after 2015. The current usage metrics is available 48-96 hours after online publication and is updated daily on week days.
Initial download of the metrics may take a while.