Open Access
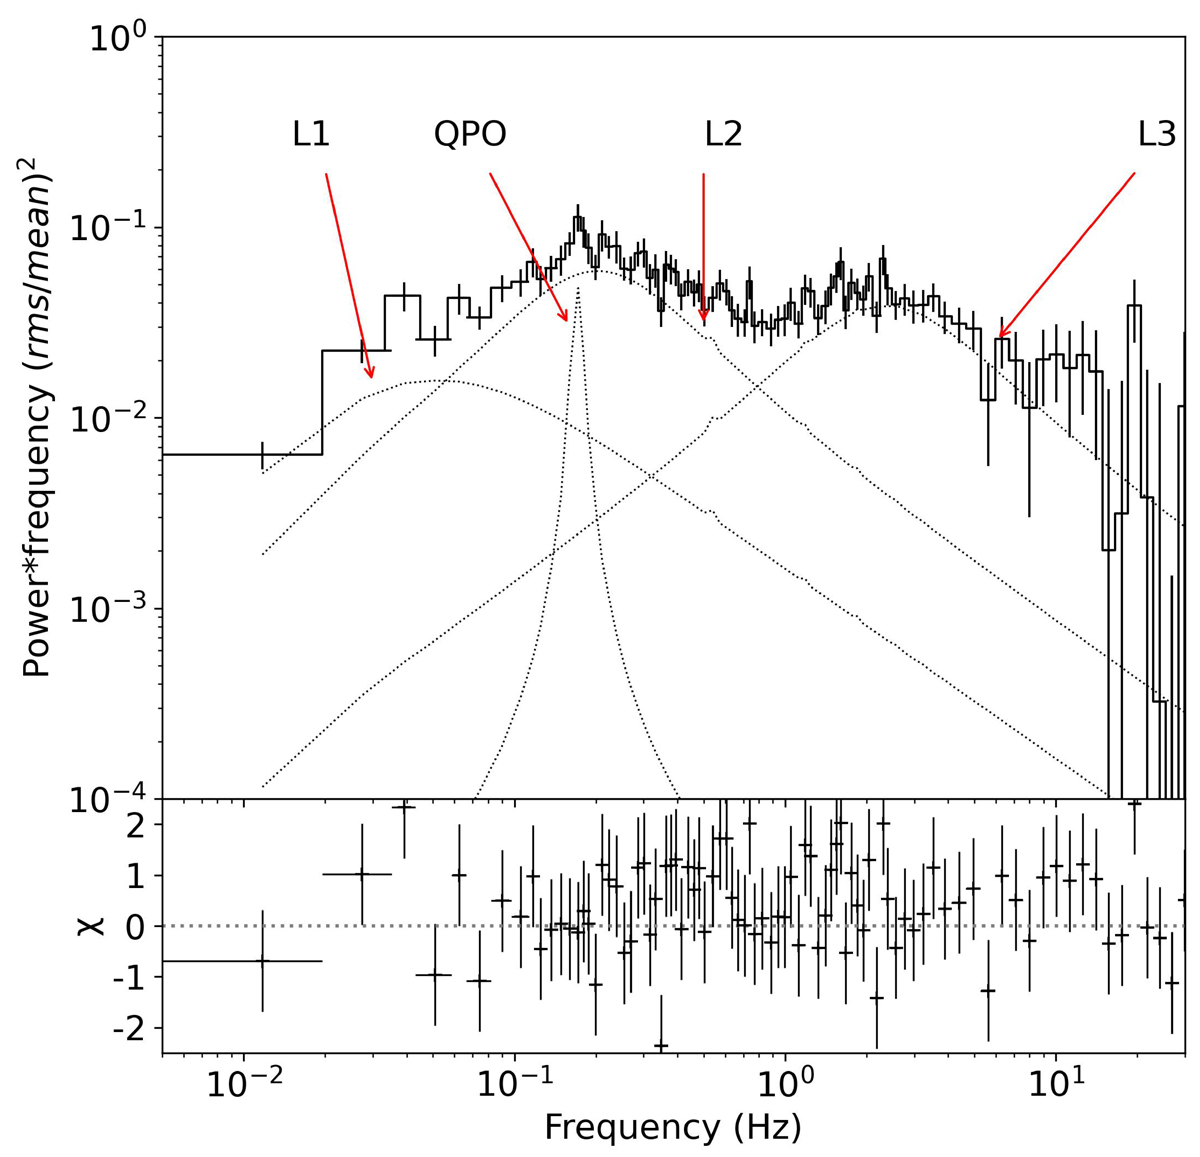
Fig. 3.
Download original image
Representative power density spectrum with the Insight-HXMT LE (1–10 keV) data. The dotted lines show the best fit with each component of a multiple-Lorentzian function. The QPO component has been shown while the three broad-band noise components are represented with the L1, L2, and L3.
Current usage metrics show cumulative count of Article Views (full-text article views including HTML views, PDF and ePub downloads, according to the available data) and Abstracts Views on Vision4Press platform.
Data correspond to usage on the plateform after 2015. The current usage metrics is available 48-96 hours after online publication and is updated daily on week days.
Initial download of the metrics may take a while.