Fig. 2.
Download original image
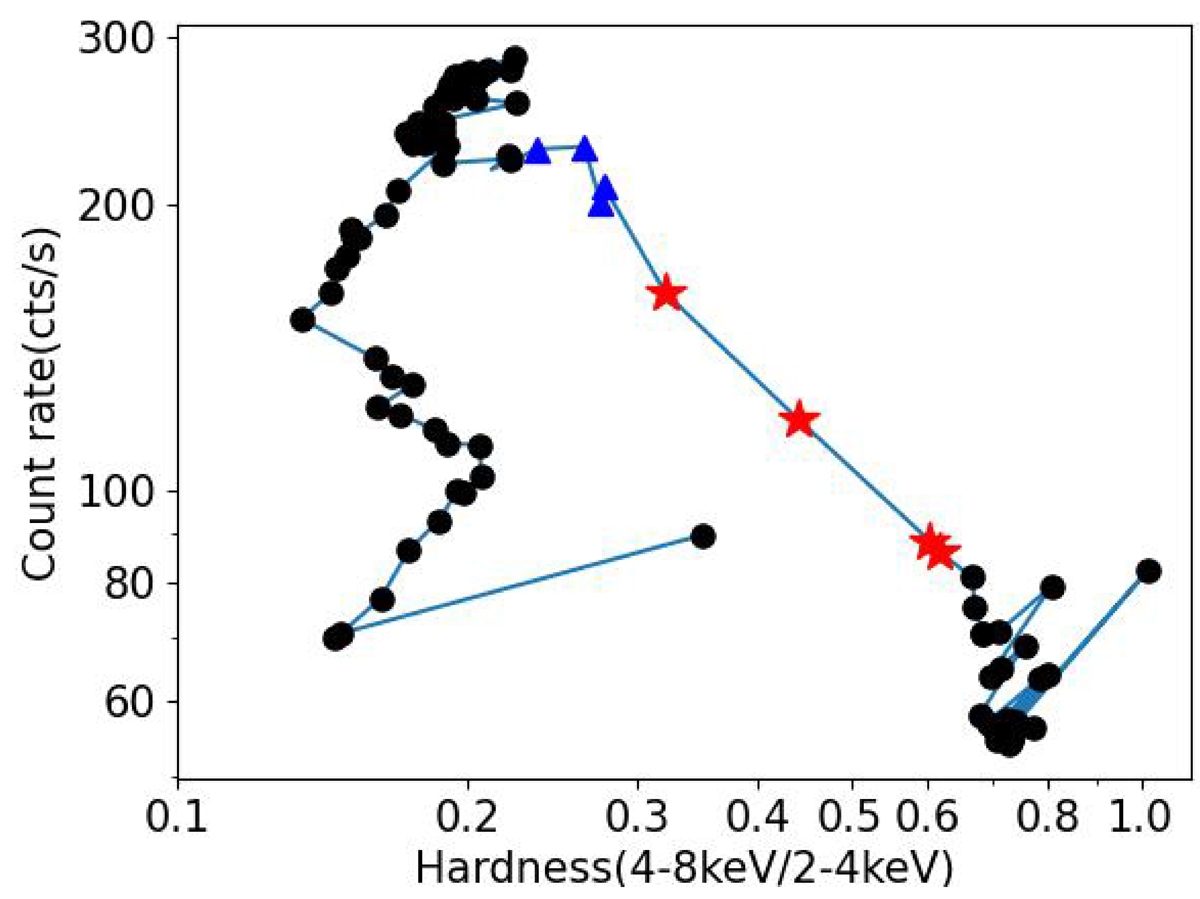
Hardness intensity diagram of GX 339−4 during the 2021 outburst. The Y-axis represents the count rate of LE from 2 − 8 keV. The hardness ratio (X-axis) is defined as the count ratio between the energy bands 2 − 4 keV and 4 − 8 keV. Each point represents one day. The red stars represent the days in the HIMS and the blue triangles represent those in the SIMS.
Current usage metrics show cumulative count of Article Views (full-text article views including HTML views, PDF and ePub downloads, according to the available data) and Abstracts Views on Vision4Press platform.
Data correspond to usage on the plateform after 2015. The current usage metrics is available 48-96 hours after online publication and is updated daily on week days.
Initial download of the metrics may take a while.