Fig. 1.
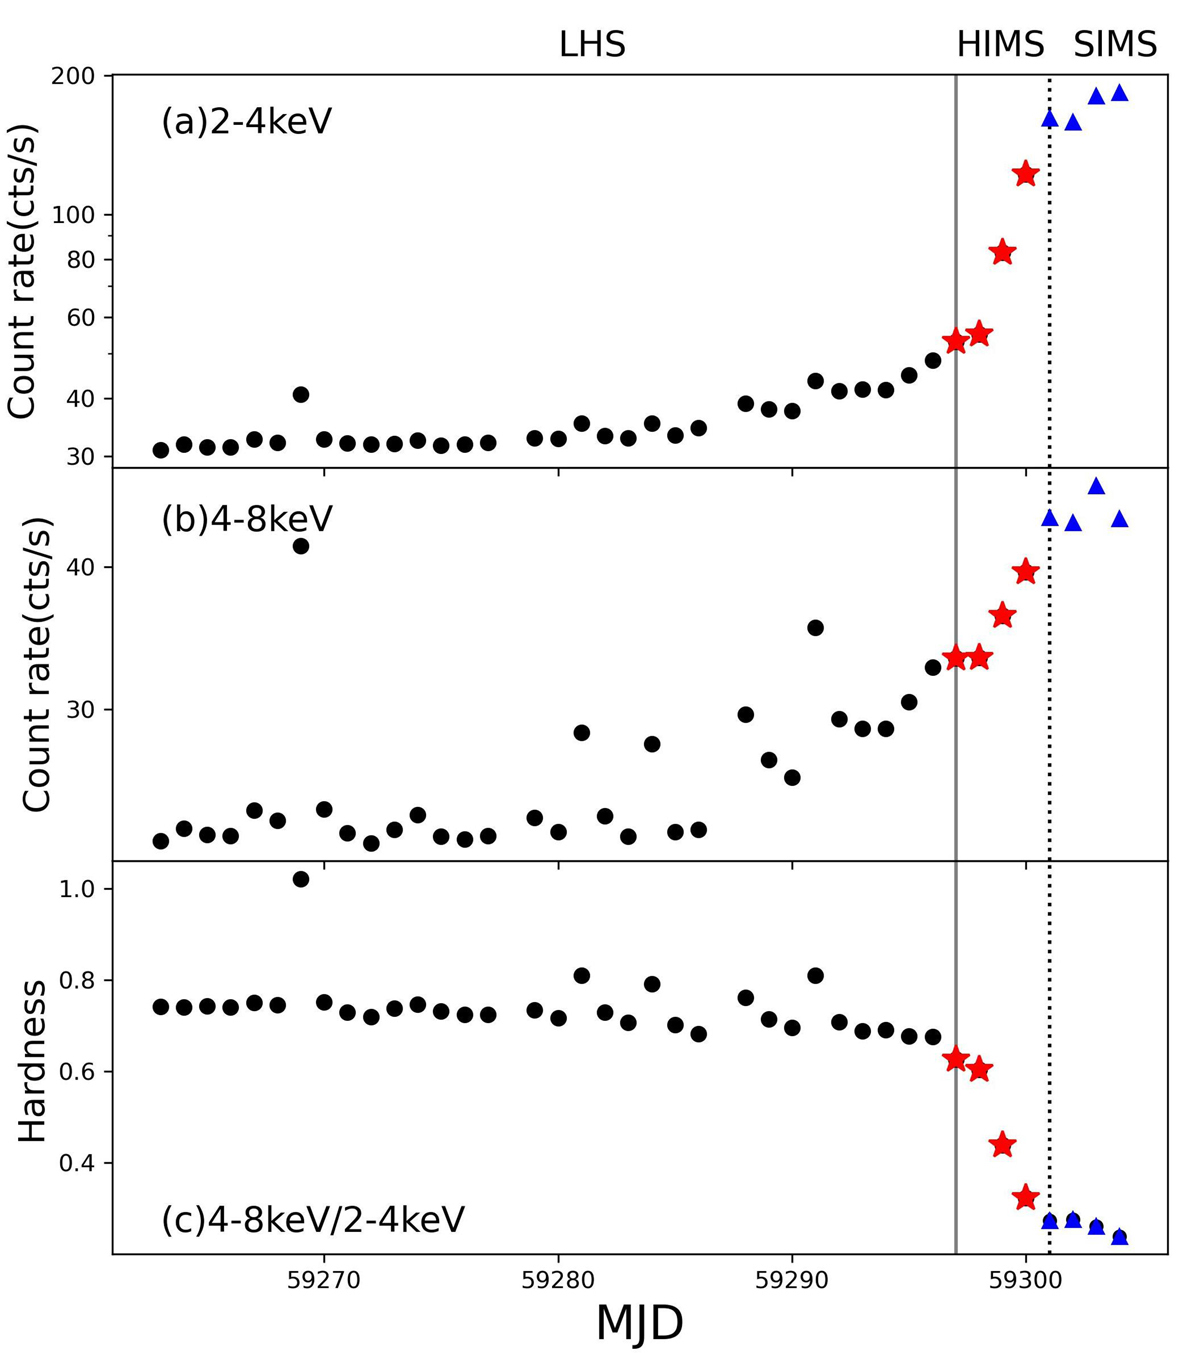
Download original image
Count rate curves of GX 339-4 with Insight-HXMT LE (2 − 4 keV) and (4 − 8 keV) data shown in the panel (a) and (b), respectively. Each point represents one day. The red stars represent the days in the HIMS and the blue triangles represent those in the SIMS. The hardness ratios are calculated with (4 − 8 keV)/(2 − 4 keV) and shown in the panel (c). The solid line marks the source in the transition from the LHS to the HIMS, and the dotted line marks the source in the transition to the SIMS.
Current usage metrics show cumulative count of Article Views (full-text article views including HTML views, PDF and ePub downloads, according to the available data) and Abstracts Views on Vision4Press platform.
Data correspond to usage on the plateform after 2015. The current usage metrics is available 48-96 hours after online publication and is updated daily on week days.
Initial download of the metrics may take a while.