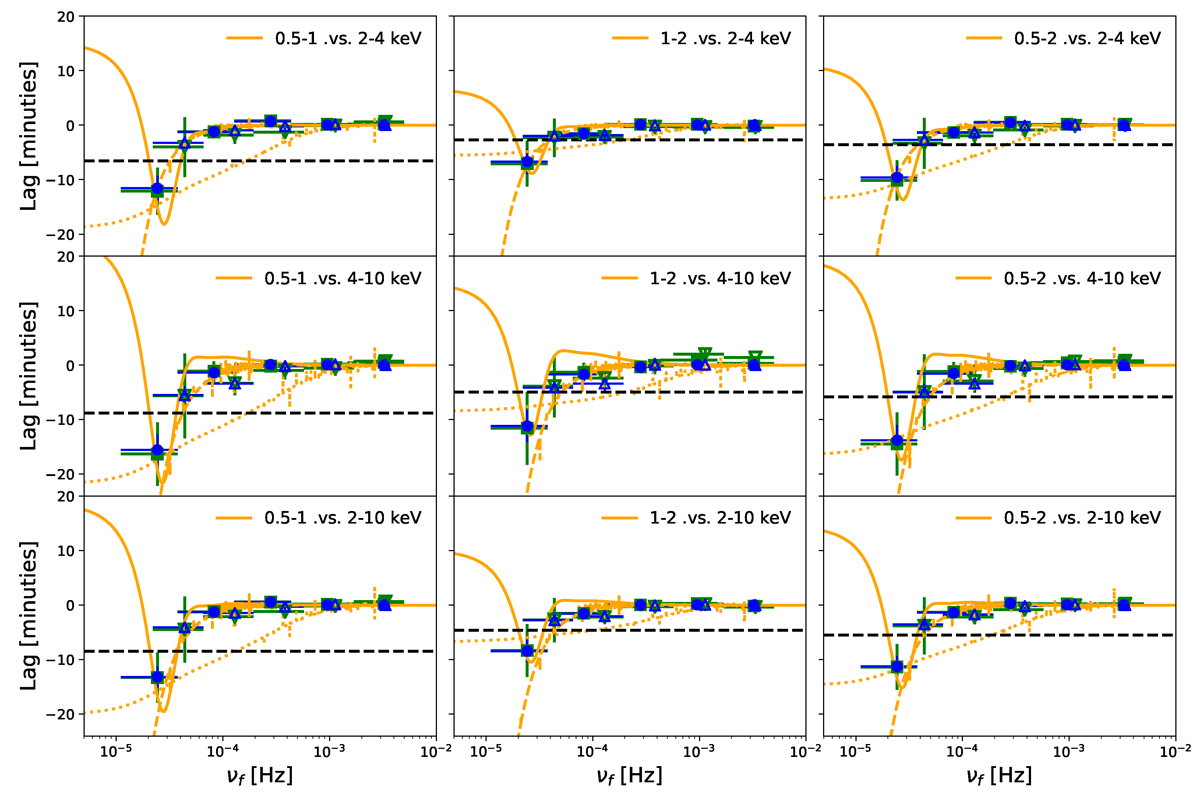
Fig. B.2.
Download original image
Fourier lag-frequency spectra measured in ObsID 0124930301. The measured lag-frequency spectra τ1 and τ2 are denoted by the closed and opened symbols, respectively (see text for details). The green squares and inverted triangles are the lag-frequency spectra calculated by the linearly interpolated LCs, while the blue points and triangles are the lag-frequency spectra calculated by the simulated LCs with GP. The orange dotted and dashed lines respectively represent the theoretical time-lag spectra expected from Case A and B in the frame of the classical one-zone synchrotron self-Compton (SSC) model. The horizontal dashed lines denote the time lags approximately calculated by the analytical method for Case A. The orange solid lines are the theoretical predictions from our proposed two-zone SSC model. The detail discussion is presented in Sect. 6.
Current usage metrics show cumulative count of Article Views (full-text article views including HTML views, PDF and ePub downloads, according to the available data) and Abstracts Views on Vision4Press platform.
Data correspond to usage on the plateform after 2015. The current usage metrics is available 48-96 hours after online publication and is updated daily on week days.
Initial download of the metrics may take a while.