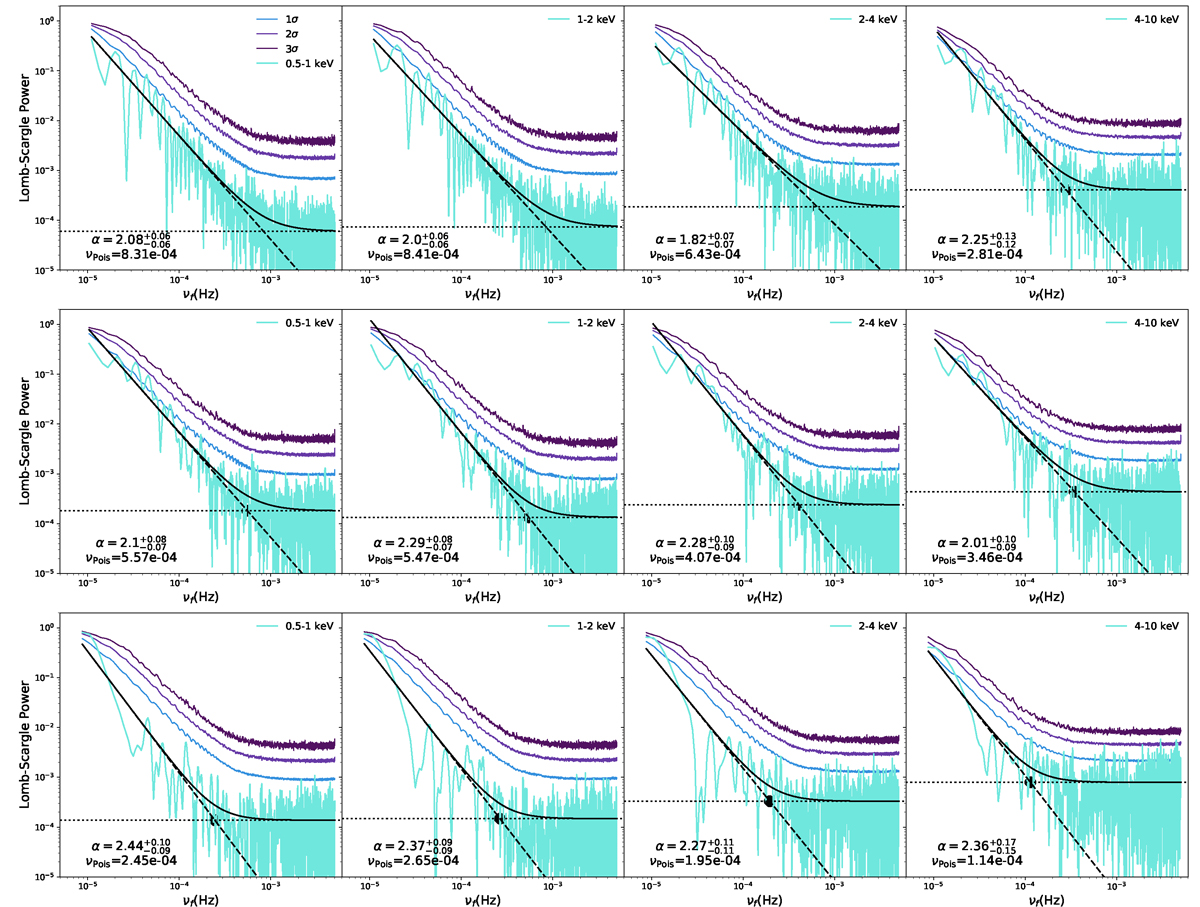
Fig. B.1.
Download original image
PSDs of PKS 2155-304 in the four sub-band observed from ObsIDs 0124930301 (top), 0124930501 (middle), and 0124930601 (bottom). The black solid circles mark the frequency threshold at which white noise starts to dominate the PSD and the dotted horizontal lines mark the white noise level for each band. 1σ, 2σ, and 3σ significance levels are calculated based on the simulation of 5000 LCs with the Gaussian process (GP) method. The resulting power is a dimensionless quantity that lies in the range 0<P<1.
Current usage metrics show cumulative count of Article Views (full-text article views including HTML views, PDF and ePub downloads, according to the available data) and Abstracts Views on Vision4Press platform.
Data correspond to usage on the plateform after 2015. The current usage metrics is available 48-96 hours after online publication and is updated daily on week days.
Initial download of the metrics may take a while.