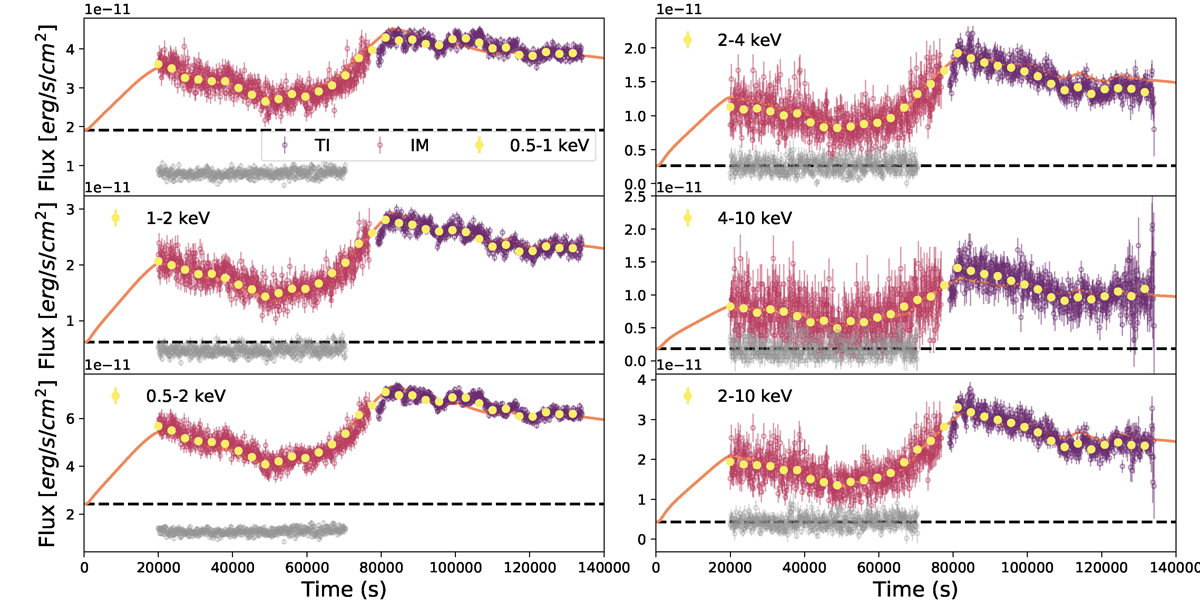
Fig. A.2.
Download original image
XMM-Newton EPIC-pn LCs from ObsID 0124930601. TI and IM represent the data in Timing and Imaging science modes, respectively. The yellow data points denote the 1 hr binned LCs. The grey circles denote the lowest X-ray flux observed in ObsID 0411780701. The dashed lines represent the flux level from the quasi-stationary zone. The orange solid lines represent the theoretical LCs reproduced by our two-zone model.
Current usage metrics show cumulative count of Article Views (full-text article views including HTML views, PDF and ePub downloads, according to the available data) and Abstracts Views on Vision4Press platform.
Data correspond to usage on the plateform after 2015. The current usage metrics is available 48-96 hours after online publication and is updated daily on week days.
Initial download of the metrics may take a while.