Fig. 4.
Download original image
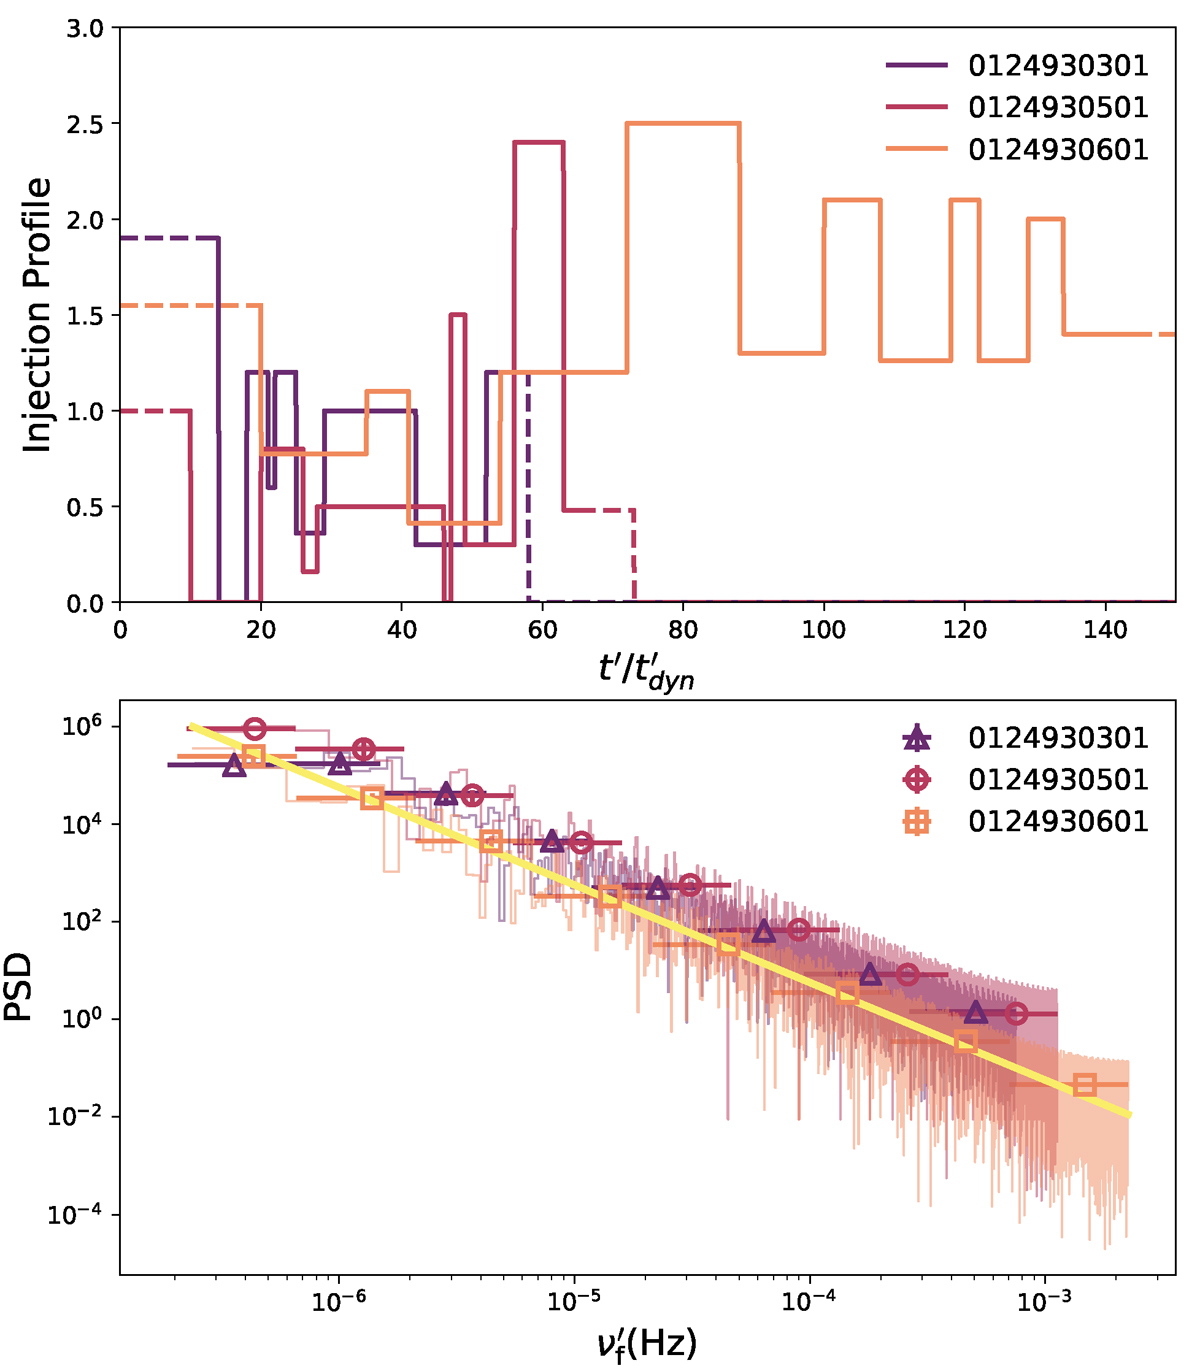
Upper panel: Time-dependent profile of the injected electrons derived from the modelling of the LCs. The portions represented by the solid lines correspond to the injections associated with the observed data. Lower panel: Corresponding PSDs. The step-shaped lines illustrate the ‘raw’ periodogram. The symbols denote the logarithmically binned versions of the PSDs. The thick yellow line shows the pure power-law PSD with an index of −2 (i.e. P(ν′f)∝ν′f−2).
Current usage metrics show cumulative count of Article Views (full-text article views including HTML views, PDF and ePub downloads, according to the available data) and Abstracts Views on Vision4Press platform.
Data correspond to usage on the plateform after 2015. The current usage metrics is available 48-96 hours after online publication and is updated daily on week days.
Initial download of the metrics may take a while.