Fig. B.1.
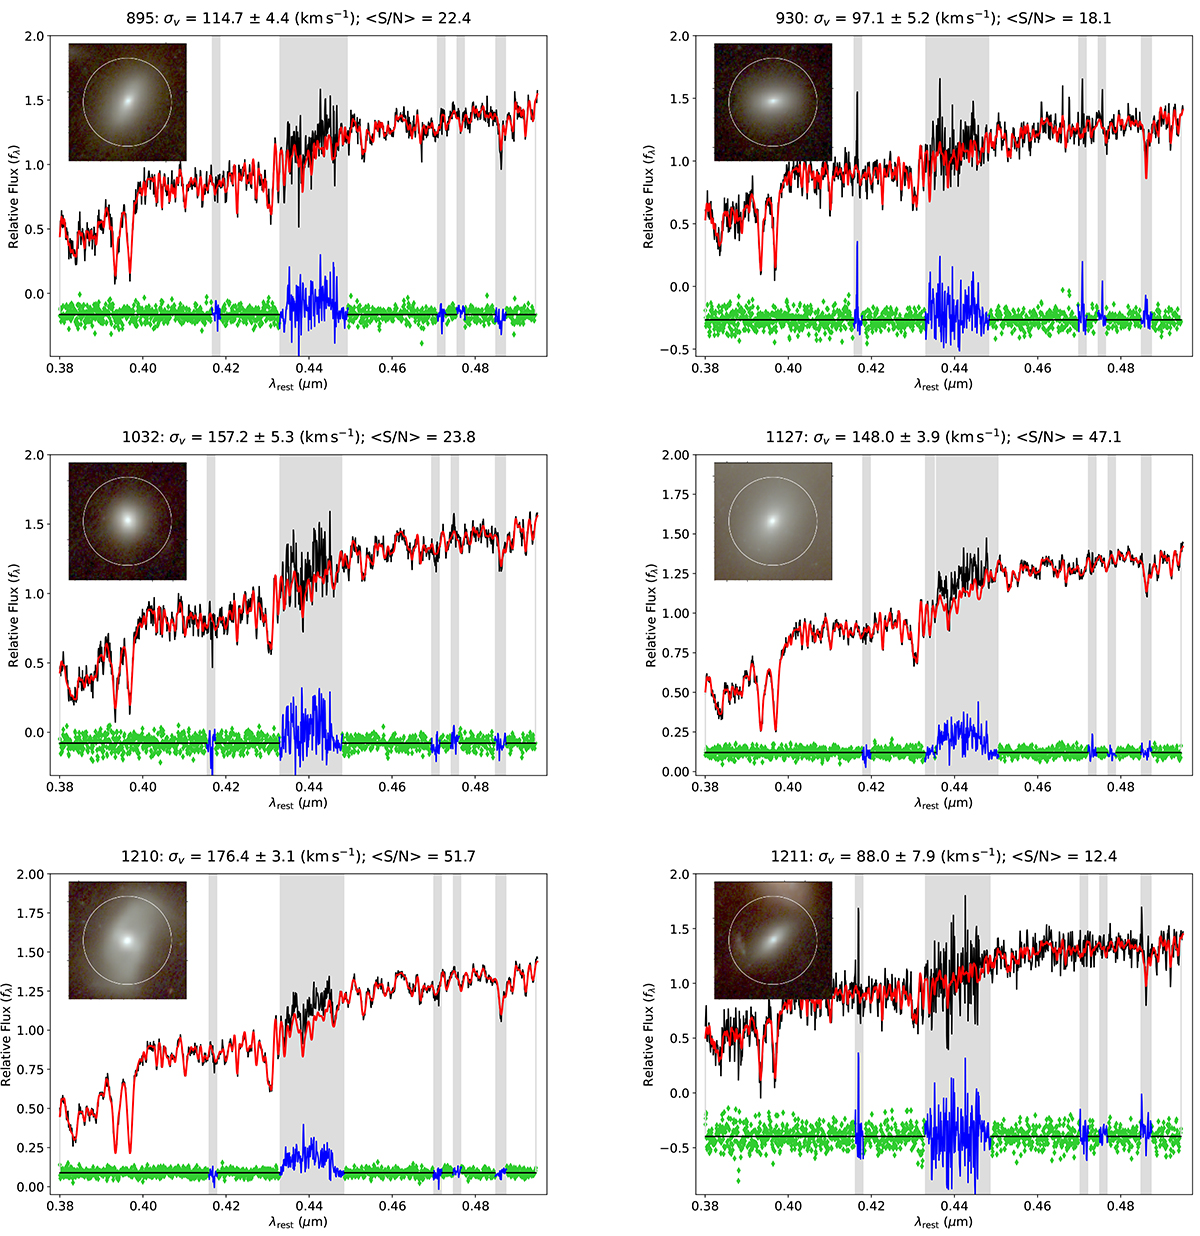
Download original image
Stellar velocity dispersion fitting with pPXF. Observed MUSE spectra are in black, and the red curves are the pPXF best-fit models. The residuals of the data with respect to the model are shown in green. The regions masked, to avoid the impact of emission lines or of the subtraction of sky, laser, or telluric lines, are shaded in grey. The data minus model residuals in these regions are marked in blue. In the top-left corner, we show a JWST red-green-blue cutout of the object, 4″ on each side, and show the apertures used for the spectral extraction from the weighted MUSE cube. Measured σv and S/N values are shown above the plot.
Current usage metrics show cumulative count of Article Views (full-text article views including HTML views, PDF and ePub downloads, according to the available data) and Abstracts Views on Vision4Press platform.
Data correspond to usage on the plateform after 2015. The current usage metrics is available 48-96 hours after online publication and is updated daily on week days.
Initial download of the metrics may take a while.