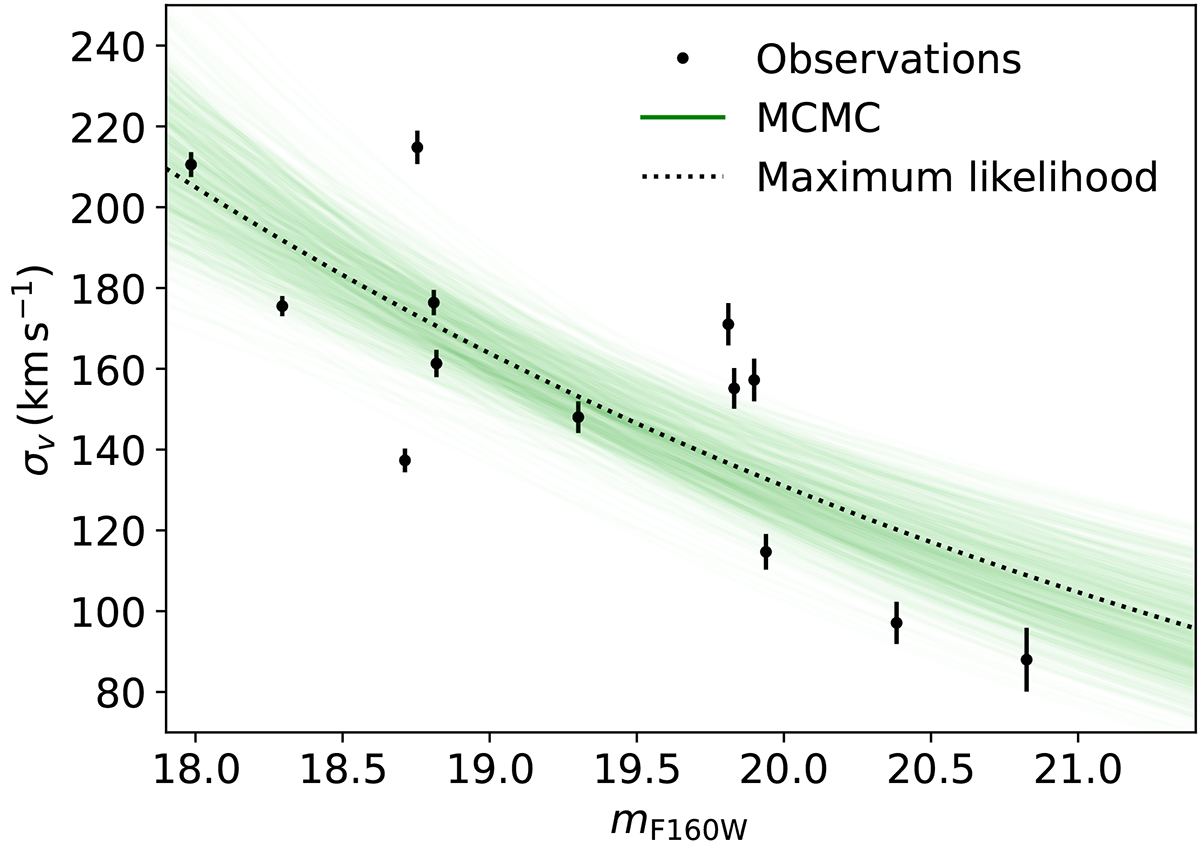
Fig. 6.
Download original image
Faber-Jackson relation for the members of MACS0138. The green lines represent 100 realisations randomly drawn from the posterior probability distribution of the scaling relation parameters, while the dotted black line shows the maximum-likelihood solution. The black dots are the 13 cluster members with an observed velocity dispersion used for the scaling law calibration.
Current usage metrics show cumulative count of Article Views (full-text article views including HTML views, PDF and ePub downloads, according to the available data) and Abstracts Views on Vision4Press platform.
Data correspond to usage on the plateform after 2015. The current usage metrics is available 48-96 hours after online publication and is updated daily on week days.
Initial download of the metrics may take a while.