Fig. 5.
Download original image
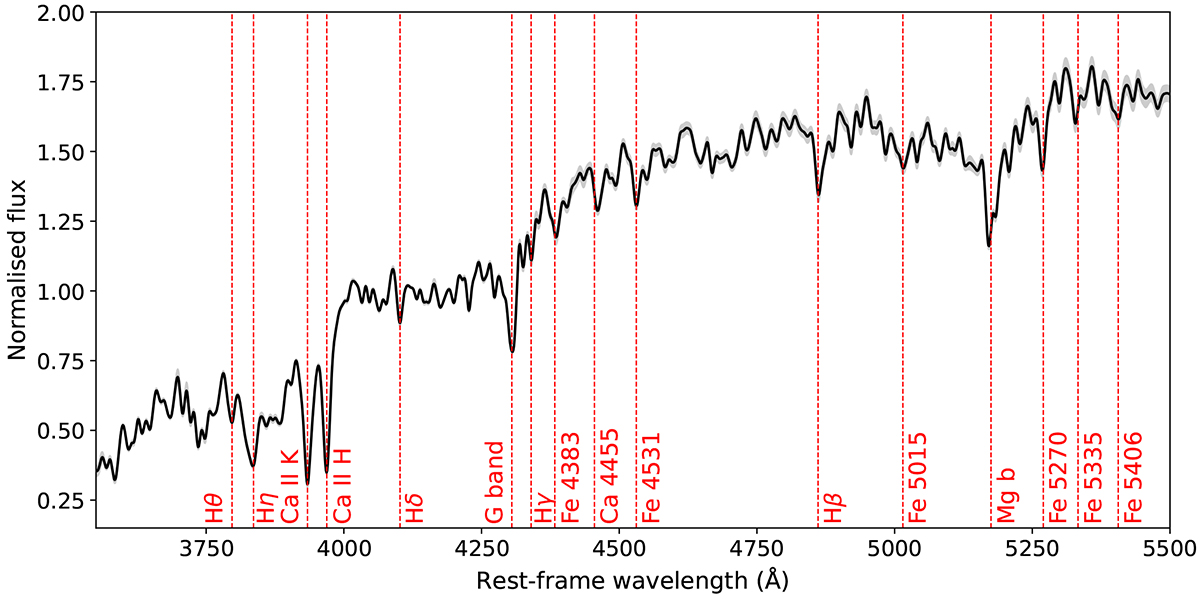
VLT/MUSE mean stacked spectrum of the 13 cluster members, all except the BCG, for which we obtained a line-of-sight stellar velocity dispersion measurement. The shaded region shows the standard deviation of each spectral pixel. The spectra were smoothed by applying a Gaussian kernel with a standard deviation of 3.75 Å. The vertical dashed red lines indicate the main absorption features of the spectrum.
Current usage metrics show cumulative count of Article Views (full-text article views including HTML views, PDF and ePub downloads, according to the available data) and Abstracts Views on Vision4Press platform.
Data correspond to usage on the plateform after 2015. The current usage metrics is available 48-96 hours after online publication and is updated daily on week days.
Initial download of the metrics may take a while.