Fig. 4.
Download original image
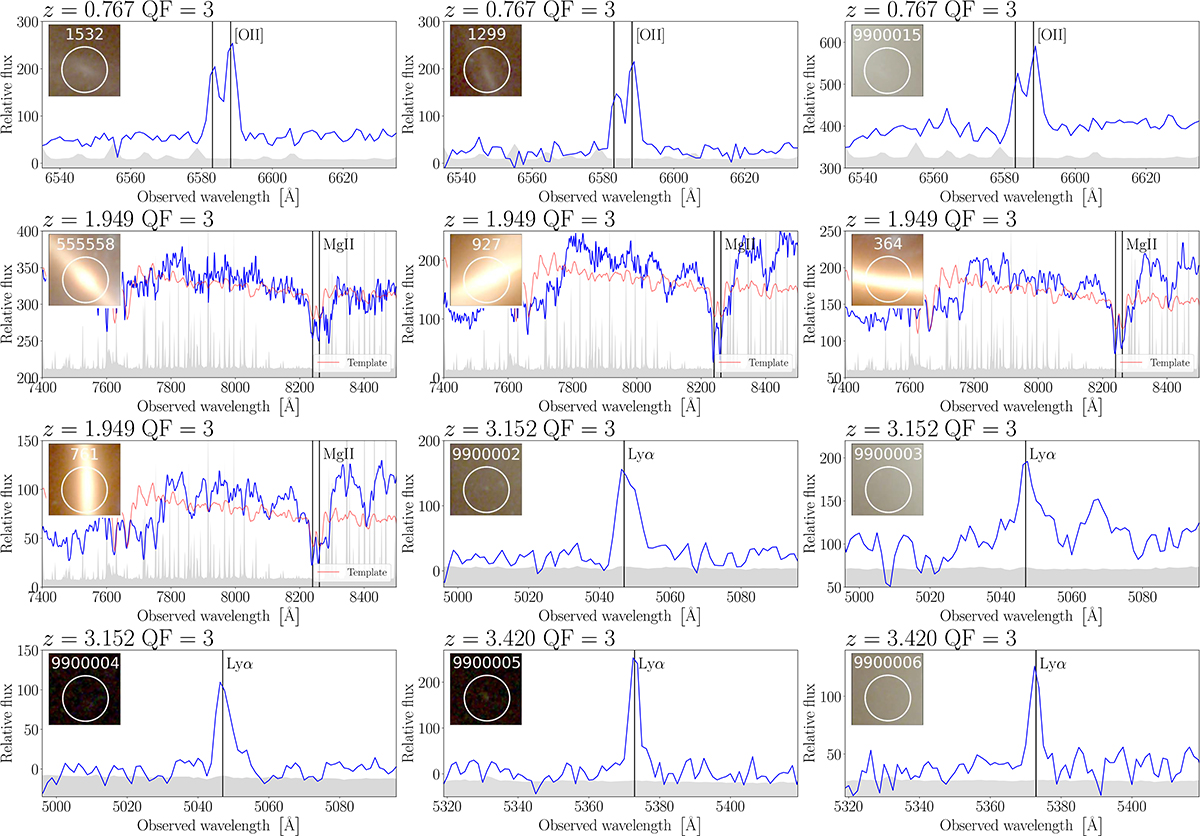
Spectra of the secure multiple images (QF = 3) included in our catalogue. The vertical line indicates the observed position of the main spectral feature used for the identification ([OII], MgII, and Lyman-α). We show the re-scaled variance in grey. The measured redshift and its QF are indicated in each figure title. The HST cutouts are 2″ on each side, and we provide the IDMUSE of the object in Table A.1.
Current usage metrics show cumulative count of Article Views (full-text article views including HTML views, PDF and ePub downloads, according to the available data) and Abstracts Views on Vision4Press platform.
Data correspond to usage on the plateform after 2015. The current usage metrics is available 48-96 hours after online publication and is updated daily on week days.
Initial download of the metrics may take a while.