Fig. 3.
Download original image
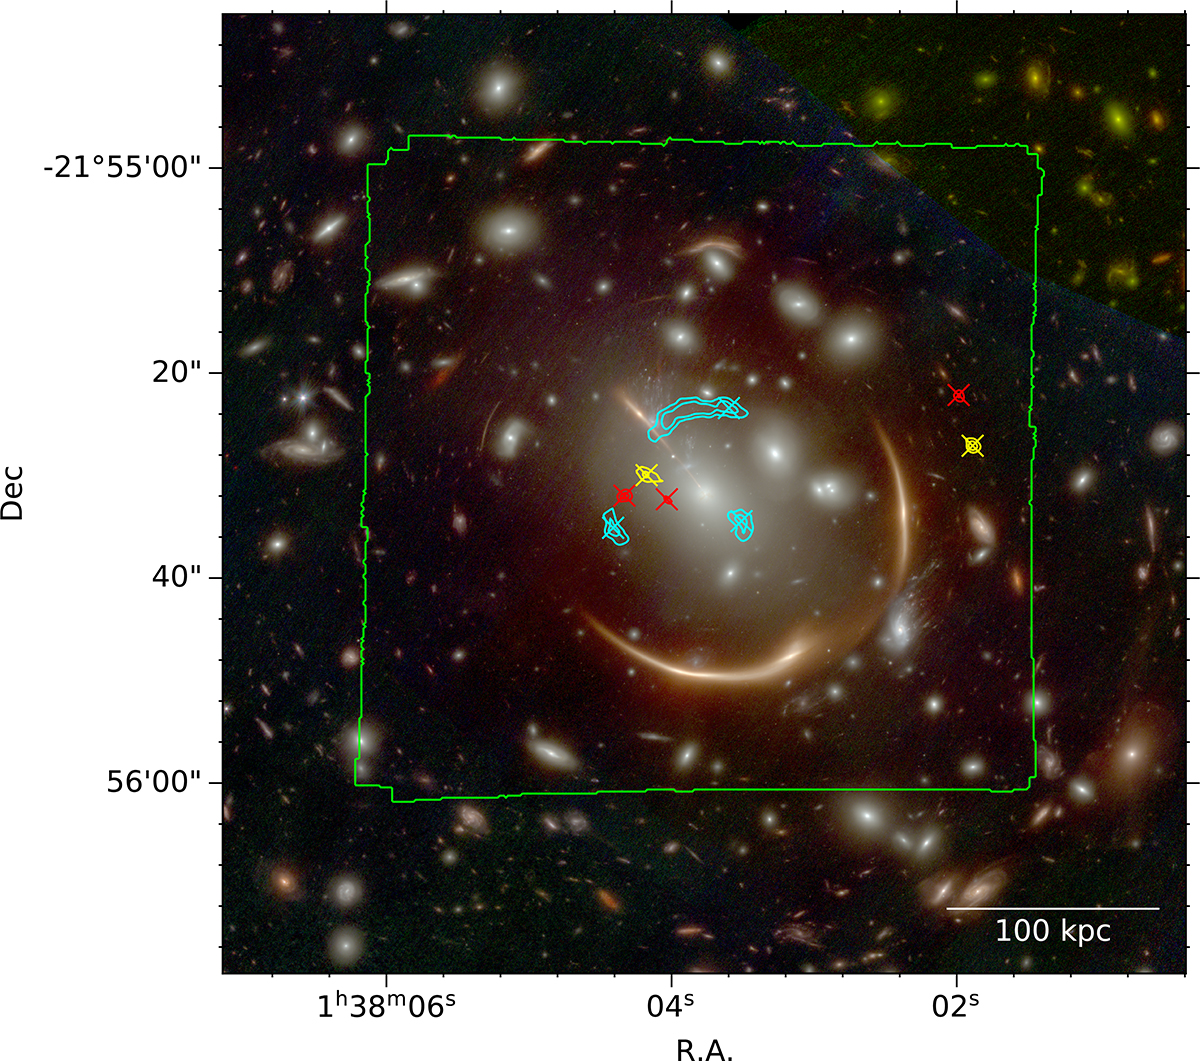
MUSE FoV of MACS0138 overlaid on a colour image built from the JWST NIRCam images (the bands used are the same as in Fig. 1). The cyan, red, and yellow lines show iso-surface-brightness contours for the MUSE cube at the wavelengths of the emission lines used to detect the three lensed sources: [OII] emission at z = 0.767 (cyan), Lyman-α emission at z = 3.152 (red) and Lyman-α emission at z = 3.420 (yellow). The two Lyman-α emissions are newly discovered sources strongly lensed by this cluster. We mark the position of the secure multiply lensed images detections (QF = 3) for the three sources (Systems 4, 5, and 6) with a cross.
Current usage metrics show cumulative count of Article Views (full-text article views including HTML views, PDF and ePub downloads, according to the available data) and Abstracts Views on Vision4Press platform.
Data correspond to usage on the plateform after 2015. The current usage metrics is available 48-96 hours after online publication and is updated daily on week days.
Initial download of the metrics may take a while.