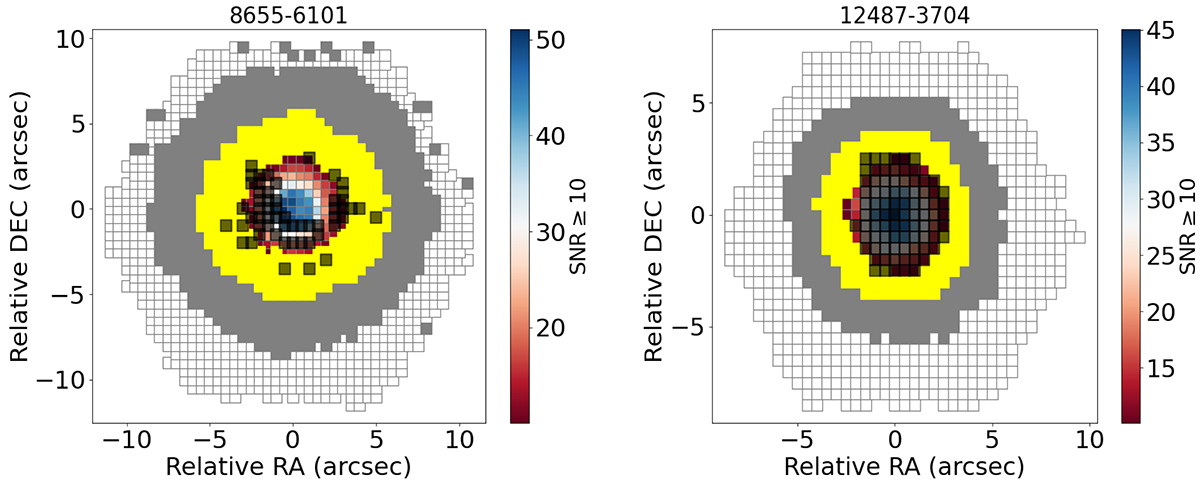
Fig. A.1.
Download original image
Spatial distribution of the SNR for the same two examples as in Figs. 2 and 3. The colourbar is set for those spaxels with S/N≥10. Those spaxels with 3≤S/N< 10 are shown in yellow to highlight the number of spaxels that would be missed when applying a threshold of S/N≥10 rather than S/N≥3 to ensure the goodness of the fit. The shaded dark spaxels represent the extension of the AGN outflow in each galaxy.
Current usage metrics show cumulative count of Article Views (full-text article views including HTML views, PDF and ePub downloads, according to the available data) and Abstracts Views on Vision4Press platform.
Data correspond to usage on the plateform after 2015. The current usage metrics is available 48-96 hours after online publication and is updated daily on week days.
Initial download of the metrics may take a while.