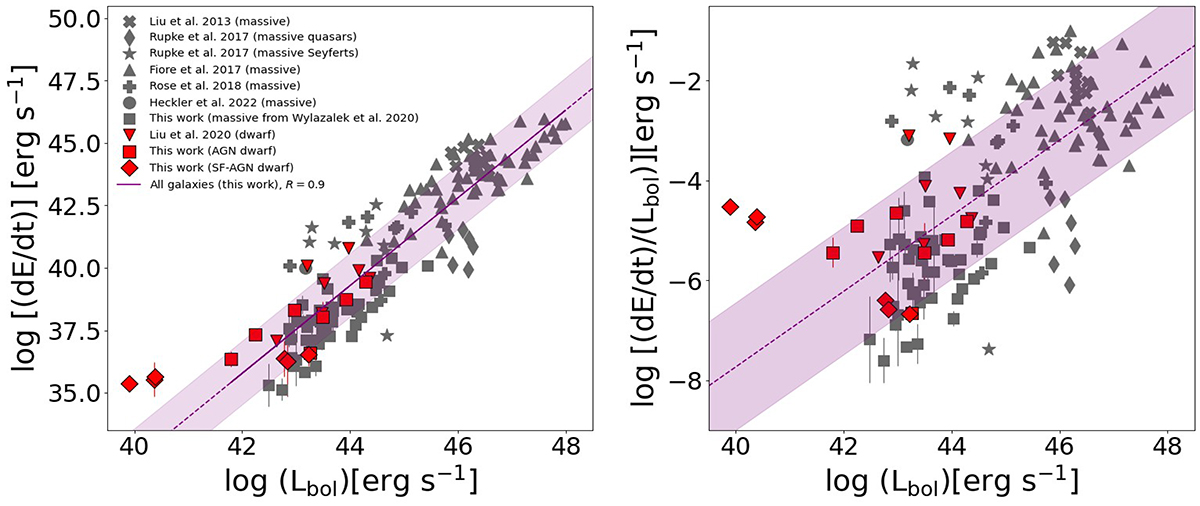
Fig. 7.
Download original image
Ionised outflow kinetic energy rate vs AGN bolometric luminosity (left) and ratio of the kinetic energy outflow rate to the AGN bolometric luminosity (right) for the MaNGA sample of dwarf galaxies with AGN outflow candidates (red squares for AGN galaxies, red diamonds for SF-AGN galaxies), the AGN dwarf galaxy sample of Liu et al. (2020) (red triangles), radio-quiet quasars of Liu et al. (2013) (grey crosses), type 1 quasars of Rupke et al. (2017) (grey diamonds), the ULIRGs of Rose et al. (2018) (grey pluses), MaNGA sample of low-intermediate luminosity massive galaxies of Wylezalek et al. (2020) (grey squares), and the massive LLAGN of Heckler et al. (2022) (grey circle). The purple solid line is a regression fit considering all the massive galaxies, the nine MaNGA dwarf galaxies with AGN outflows, and those from Liu et al. (2020). The shaded area corresponds to the 1σ error of the regression line.
Current usage metrics show cumulative count of Article Views (full-text article views including HTML views, PDF and ePub downloads, according to the available data) and Abstracts Views on Vision4Press platform.
Data correspond to usage on the plateform after 2015. The current usage metrics is available 48-96 hours after online publication and is updated daily on week days.
Initial download of the metrics may take a while.