Fig. 2.
Download original image
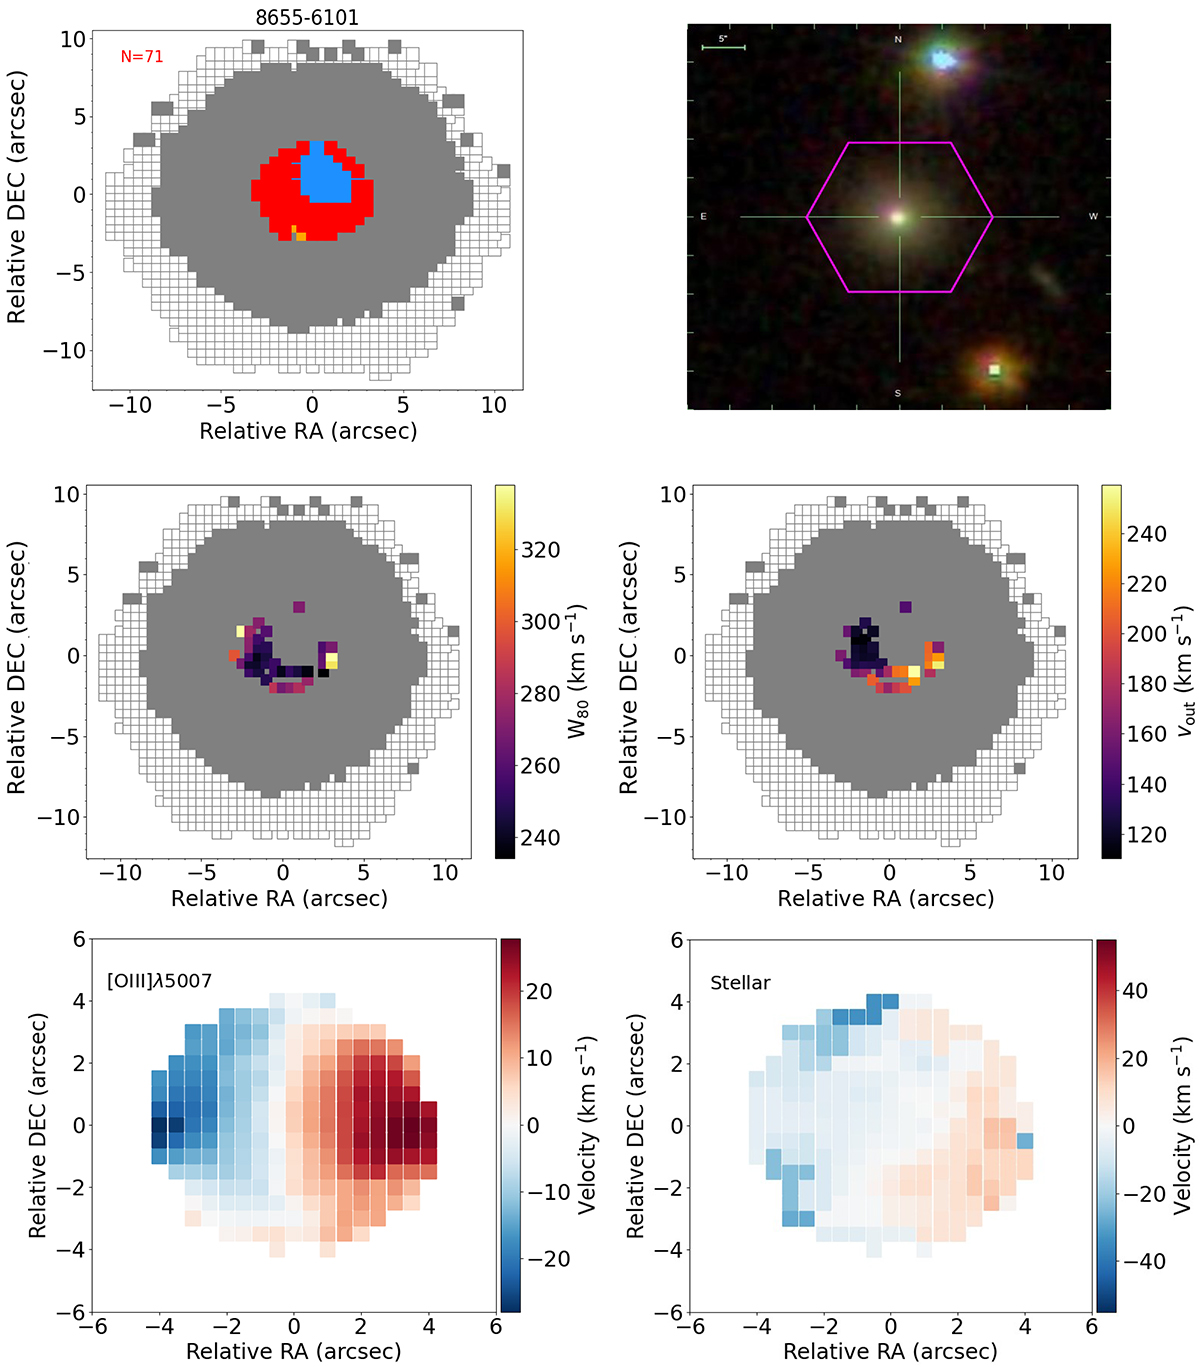
MaNGA analysis for one of the dwarf galaxies with AGN outflow candidates (8655−6101). Top left: Spatial distribution of the BPT-classified spaxels (red: AGN; green: composite; blue: SF; orange: LINER). The ‘N’ shows the number of AGN and composite spaxels used in the analysis. Top right: SDSS composite image. The pink hexagon shows the IFU coverage. Middle: Spatial W80 (left) and vout (right) outflow velocity distribution, where we can see the extension of the outflow. Empty squares mark the IFU coverage and grey squares those spaxels with a continuum S/N > 1. Bottom: MaNGA [OIII]λ5007 Å velocity map (left) and stellar velocity (right).
Current usage metrics show cumulative count of Article Views (full-text article views including HTML views, PDF and ePub downloads, according to the available data) and Abstracts Views on Vision4Press platform.
Data correspond to usage on the plateform after 2015. The current usage metrics is available 48-96 hours after online publication and is updated daily on week days.
Initial download of the metrics may take a while.