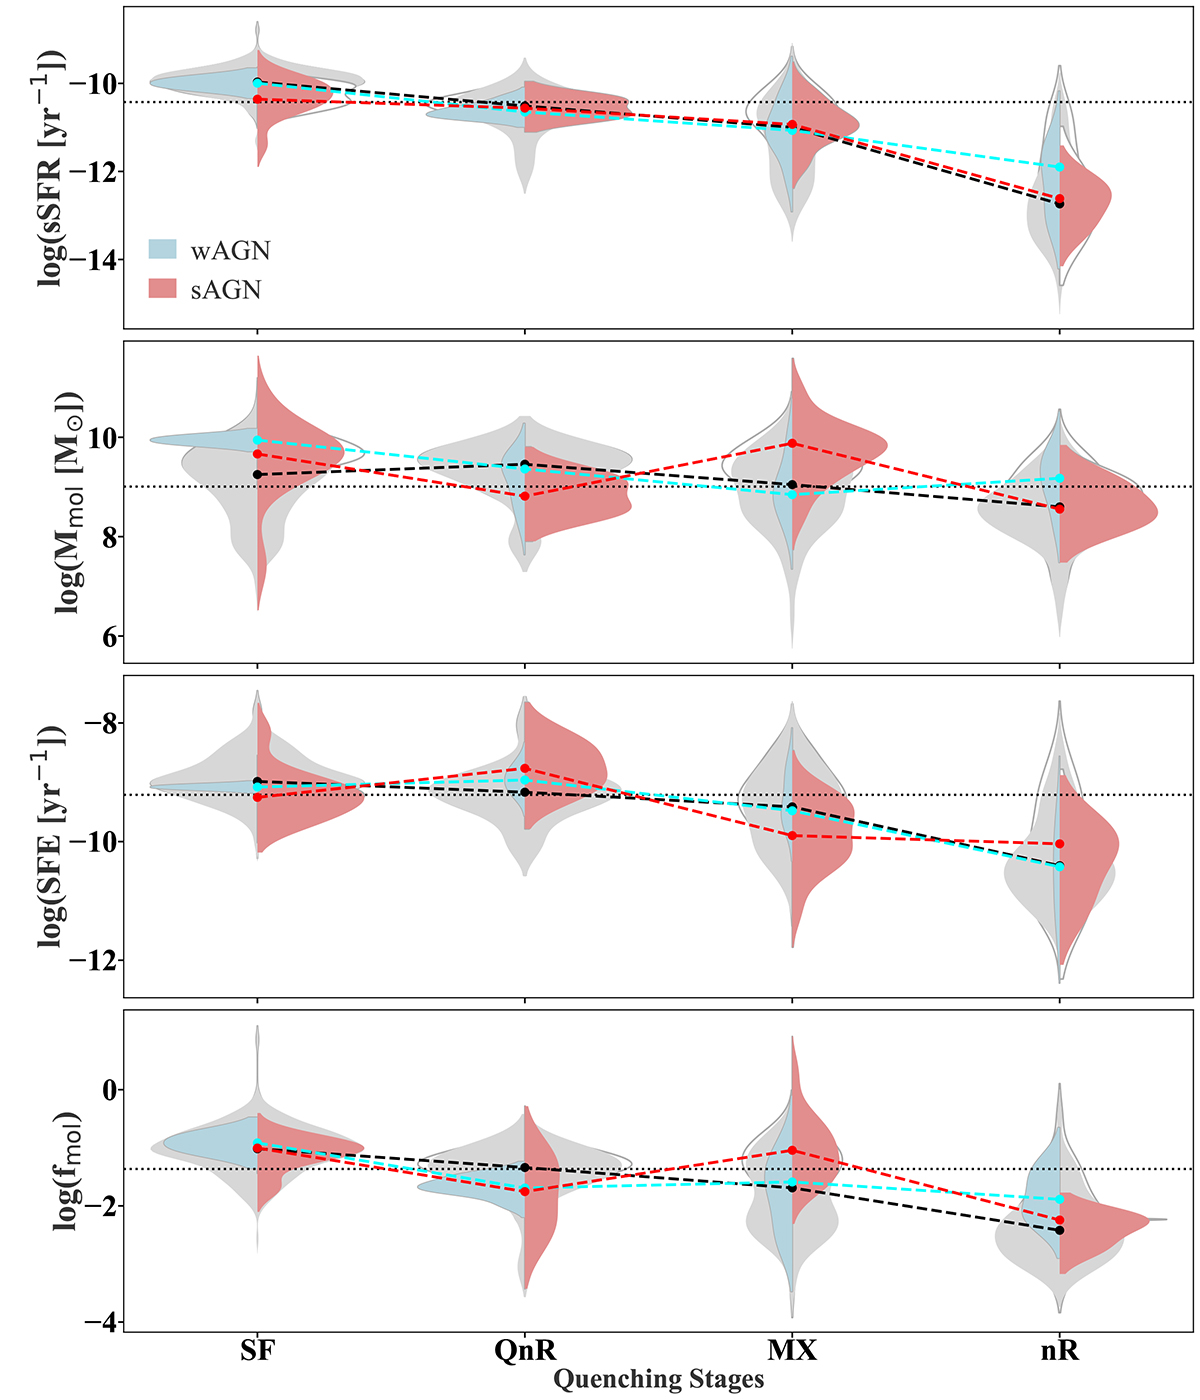
Fig. B.1.
Download original image
Violin plots showing the variation of global sSFR, Mmol, SFE and fmol properties for all quenching stages hosting AGNs. The transparent violin plots show the distribution of the properties of the detected galaxies. The dotted horizontal black line represents the median value of the sample, and the dashed lines represent the median variation throughout the quenching stages, depending on the nuclear activity. The small triangles represent the medians for only the detected samples. Note that black points represent the medians for the whole sample, including all nuclear activities.
Current usage metrics show cumulative count of Article Views (full-text article views including HTML views, PDF and ePub downloads, according to the available data) and Abstracts Views on Vision4Press platform.
Data correspond to usage on the plateform after 2015. The current usage metrics is available 48-96 hours after online publication and is updated daily on week days.
Initial download of the metrics may take a while.