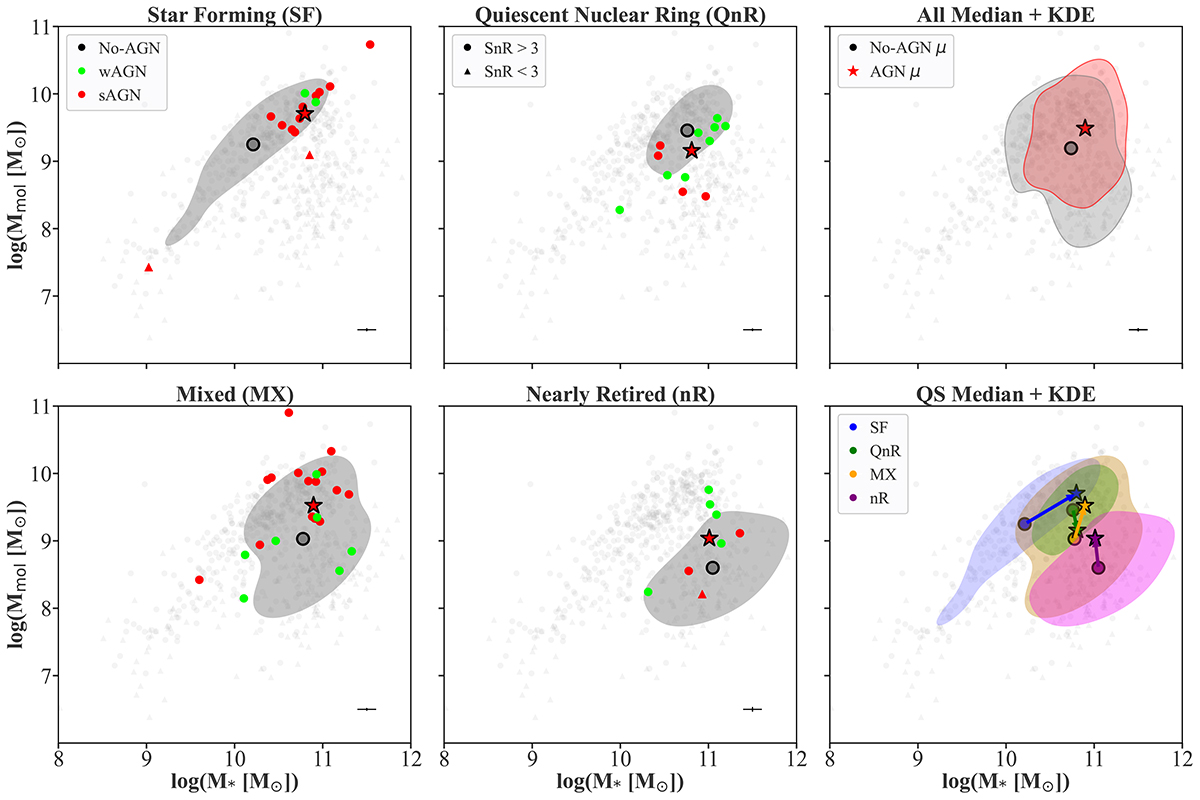
Fig. 6.
Download original image
Mmol–M⋆ scaling relation throughout the different quenching stages. The medians of the different nuclear activities of the galaxies are represented in the diagrams according to quenching stages that host an AGN (four left plots), combined quenching stages (upper right), non-actives across quenching stages vs. actives across quenching stages (bottom right). The arrows connect the AGN median to the non-active median in each QS. Error bars are represented in the bottom right of the figures and vary according to quenching stages. 1σ KDE contours are shown in the plots for the non-active galaxies, except in the upper right, where contours are shown for both active (red) and non-active (gray) galaxies without quenching stage segregation.
Current usage metrics show cumulative count of Article Views (full-text article views including HTML views, PDF and ePub downloads, according to the available data) and Abstracts Views on Vision4Press platform.
Data correspond to usage on the plateform after 2015. The current usage metrics is available 48-96 hours after online publication and is updated daily on week days.
Initial download of the metrics may take a while.