Open Access
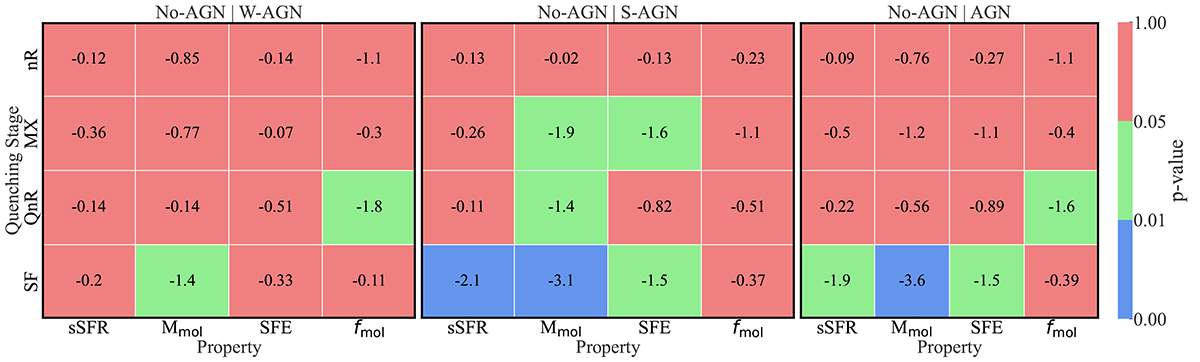
Fig. B.2.
Download original image
P-values obtained from the KS two-sample test between active and non-active galaxy properties across the different quenching stages for only the S/N > 3 galaxies. The values shown in the tables are logarithmic.
Current usage metrics show cumulative count of Article Views (full-text article views including HTML views, PDF and ePub downloads, according to the available data) and Abstracts Views on Vision4Press platform.
Data correspond to usage on the plateform after 2015. The current usage metrics is available 48-96 hours after online publication and is updated daily on week days.
Initial download of the metrics may take a while.