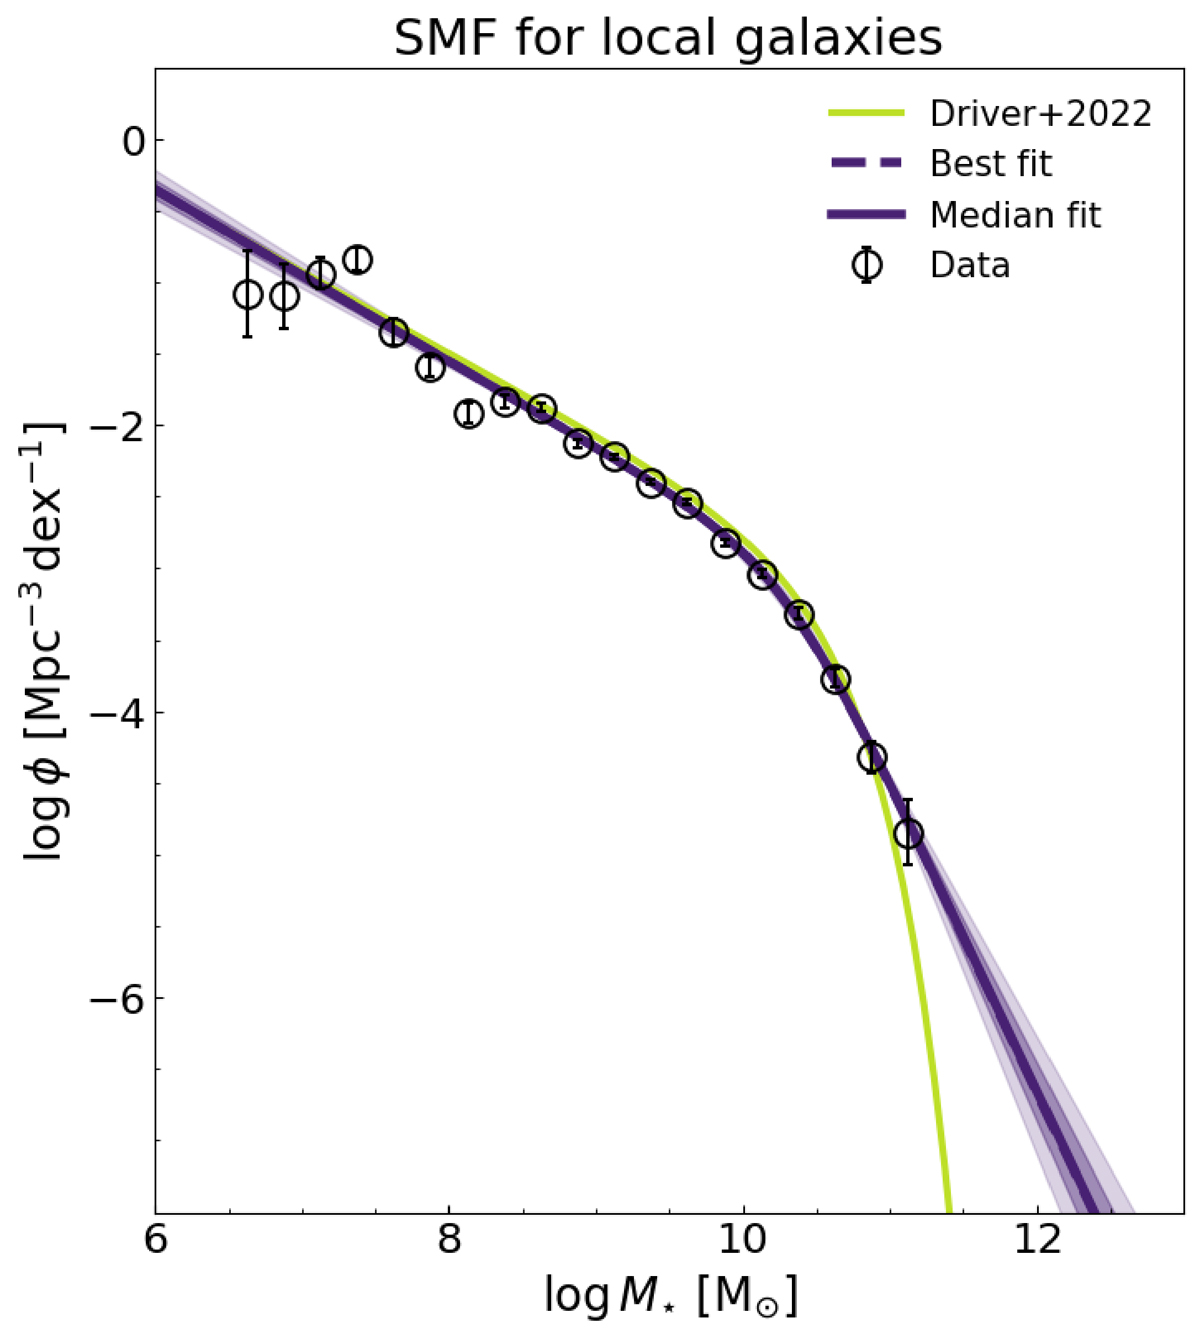
Fig. A.1.
Download original image
Results of the fit of a Double Power Law (dark blue curve) to the observed SMFs for local (z < 0.08) SFGs from Driver et al. (2022). Solid lines refer to the median of the posterior distribution, while dotted lines represent the maximum likelihood model. Shaded areas represent the 1- and 2-σ uncertainty interval obtained from the 2nd, 16th, 84th and 97th percentiles of the posterior distribution. Our fits are compared to the results of Driver et al. (2022) (green curve) inferred from a single Schechter function. Points are the observed SMFs for local SFGs of Driver et al. (2022).
Current usage metrics show cumulative count of Article Views (full-text article views including HTML views, PDF and ePub downloads, according to the available data) and Abstracts Views on Vision4Press platform.
Data correspond to usage on the plateform after 2015. The current usage metrics is available 48-96 hours after online publication and is updated daily on week days.
Initial download of the metrics may take a while.