Fig. 6.
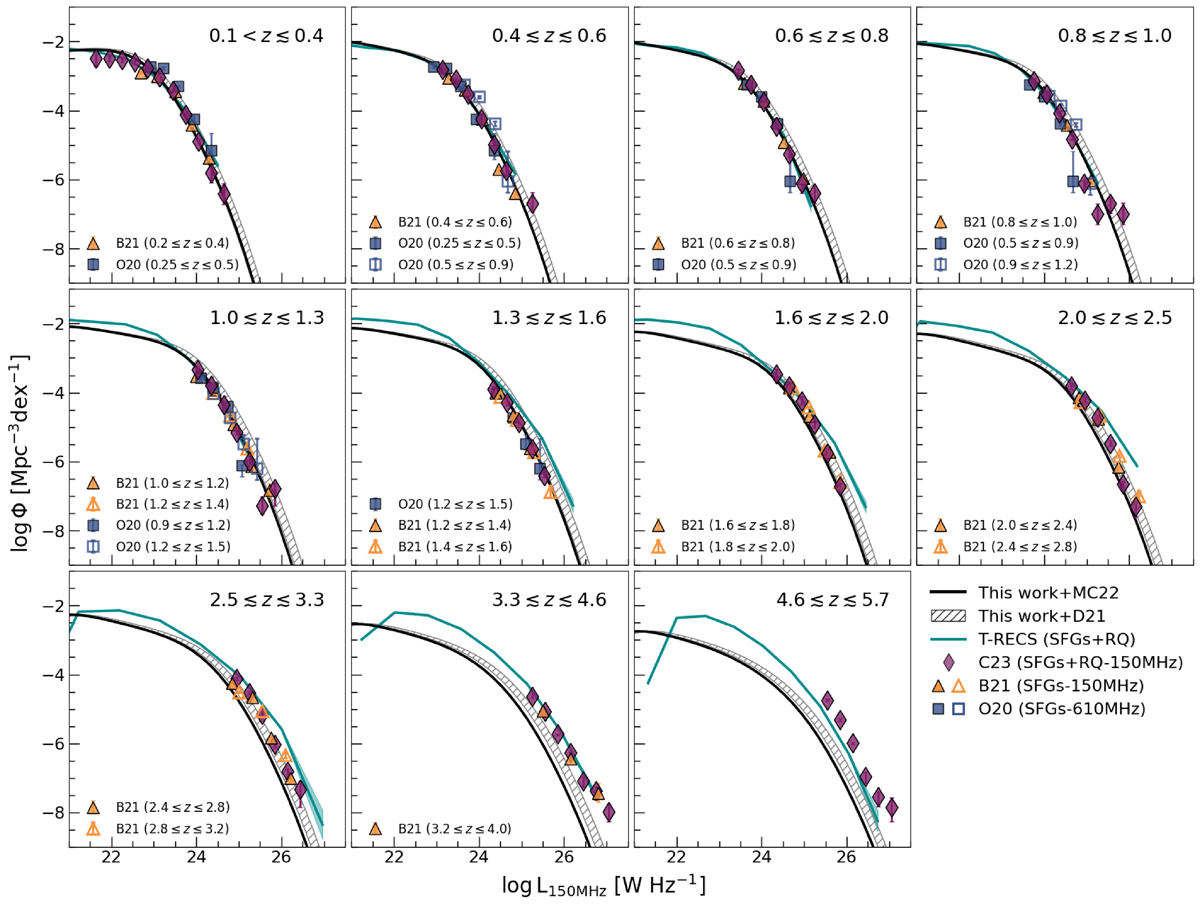
Download original image
150 MHz LFs for SFGs at different redshift bins predicted by SEMPER. The model is derived by assuming the mass-dependent FIRRC from Delvecchio et al. (2021) (solid black line) and McCheyne et al. (2022) (hatched grey area). As in Fig. 2, Eq. (11) is applied only to the first redshift bin. Data points (symbols as in legend) are from Cochrane et al. (2023), Bonato et al. (2021a) and Ocran et al. (2020a). The latter are scaled from 610 MHz to 150 MHz assuming α = −0.7. Cyan lines and shaded areas are the predictions from the T-RECS simulation by Bonaldi et al. (2019, 2023) and their 1σ uncertainties, respectively.
Current usage metrics show cumulative count of Article Views (full-text article views including HTML views, PDF and ePub downloads, according to the available data) and Abstracts Views on Vision4Press platform.
Data correspond to usage on the plateform after 2015. The current usage metrics is available 48-96 hours after online publication and is updated daily on week days.
Initial download of the metrics may take a while.