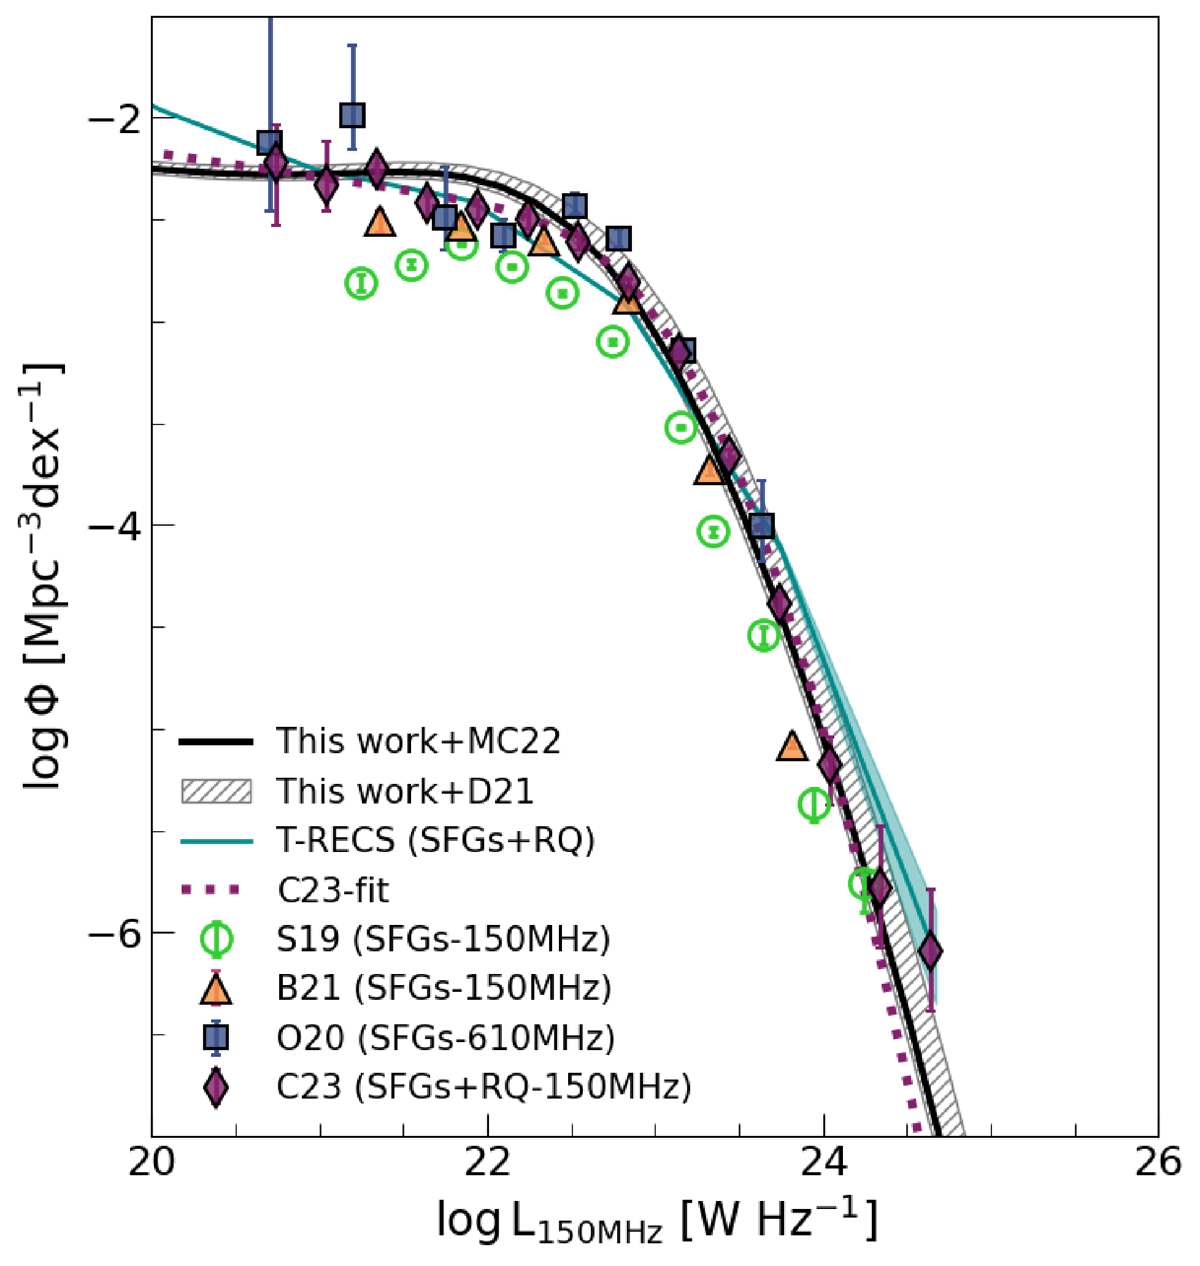
Fig. 5.
Download original image
150 MHz LF for SFGs from SEMPER at z ∼ 0. The model is obtained from Eqs. (7) and (8) (hatched grey area) using a spectral index range of α = [ − 0.8, −0.6] and by applying Eq. (11). Data points are from Sabater et al. (2019), Bonato et al. (2021a) and Cochrane et al. (2023) at 150 MHz and Ocran et al. (2020a) at 640 MHz (rescaled assuming α = −0.7). The dotted line refers to the best-fit modified Schechter function presented in Cochrane et al. (2023). The shaded area is from the T-RECS simulation (Bonaldi et al. 2019, 2023).
Current usage metrics show cumulative count of Article Views (full-text article views including HTML views, PDF and ePub downloads, according to the available data) and Abstracts Views on Vision4Press platform.
Data correspond to usage on the plateform after 2015. The current usage metrics is available 48-96 hours after online publication and is updated daily on week days.
Initial download of the metrics may take a while.