Fig. 4.
Download original image
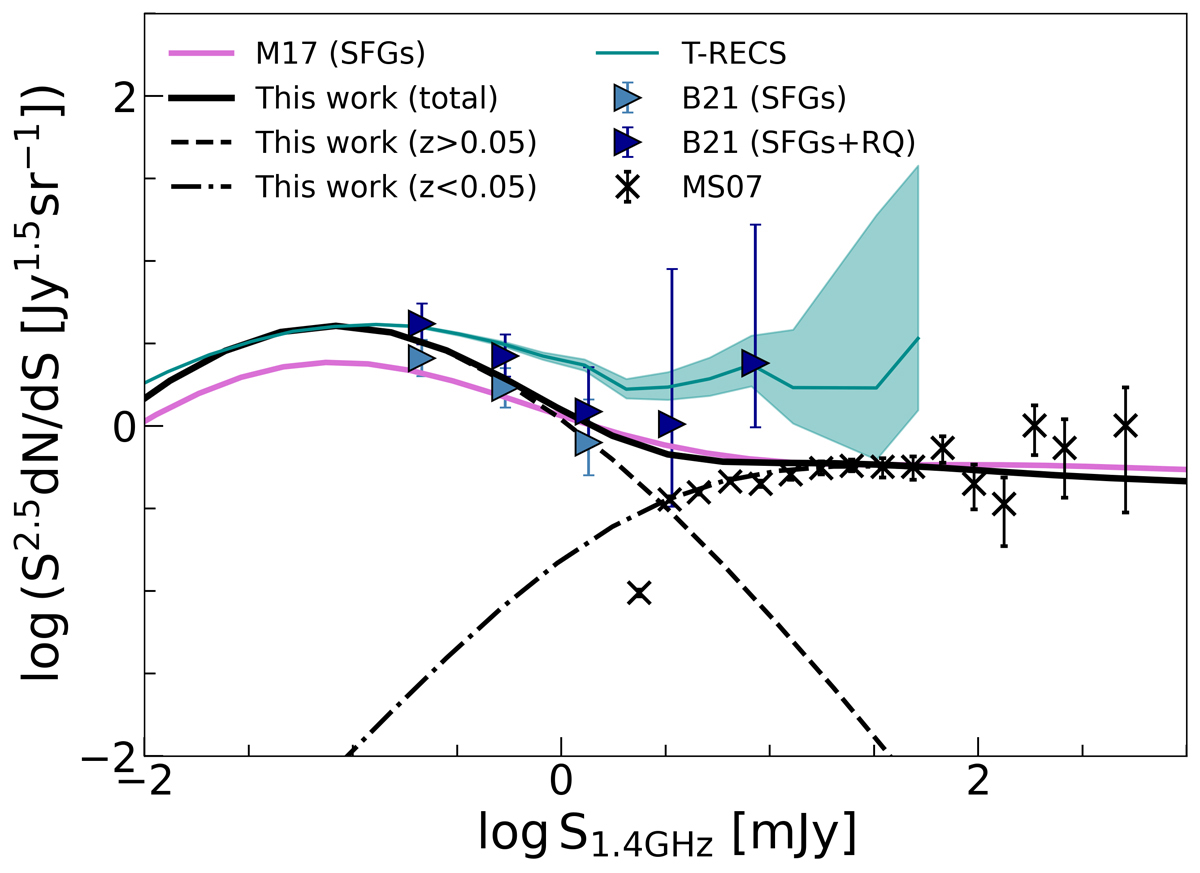
1.4 GHz Euclidean normalised differential number counts from SEMPER for SFGs (black solid line) obtained adopting the relation of Delvecchio et al. (2021). The dashed and dot-dashed lines represent the contribution for galaxies located respectively above and below z ∼ 0.05. The solid pink line is the prediction from Mancuso et al. (2017). Triangles are data from Bonato et al. (2021b) for SFGs (light blue) and SFGs and RQ sources combined (dark blue). In cyan, we display the predictions from the T-RECS simulation by Bonaldi et al. (2019, 2023). Black crosses show the number counts for local galaxies from Mauch & Sadler (2007).
Current usage metrics show cumulative count of Article Views (full-text article views including HTML views, PDF and ePub downloads, according to the available data) and Abstracts Views on Vision4Press platform.
Data correspond to usage on the plateform after 2015. The current usage metrics is available 48-96 hours after online publication and is updated daily on week days.
Initial download of the metrics may take a while.