Fig. 3.
Download original image
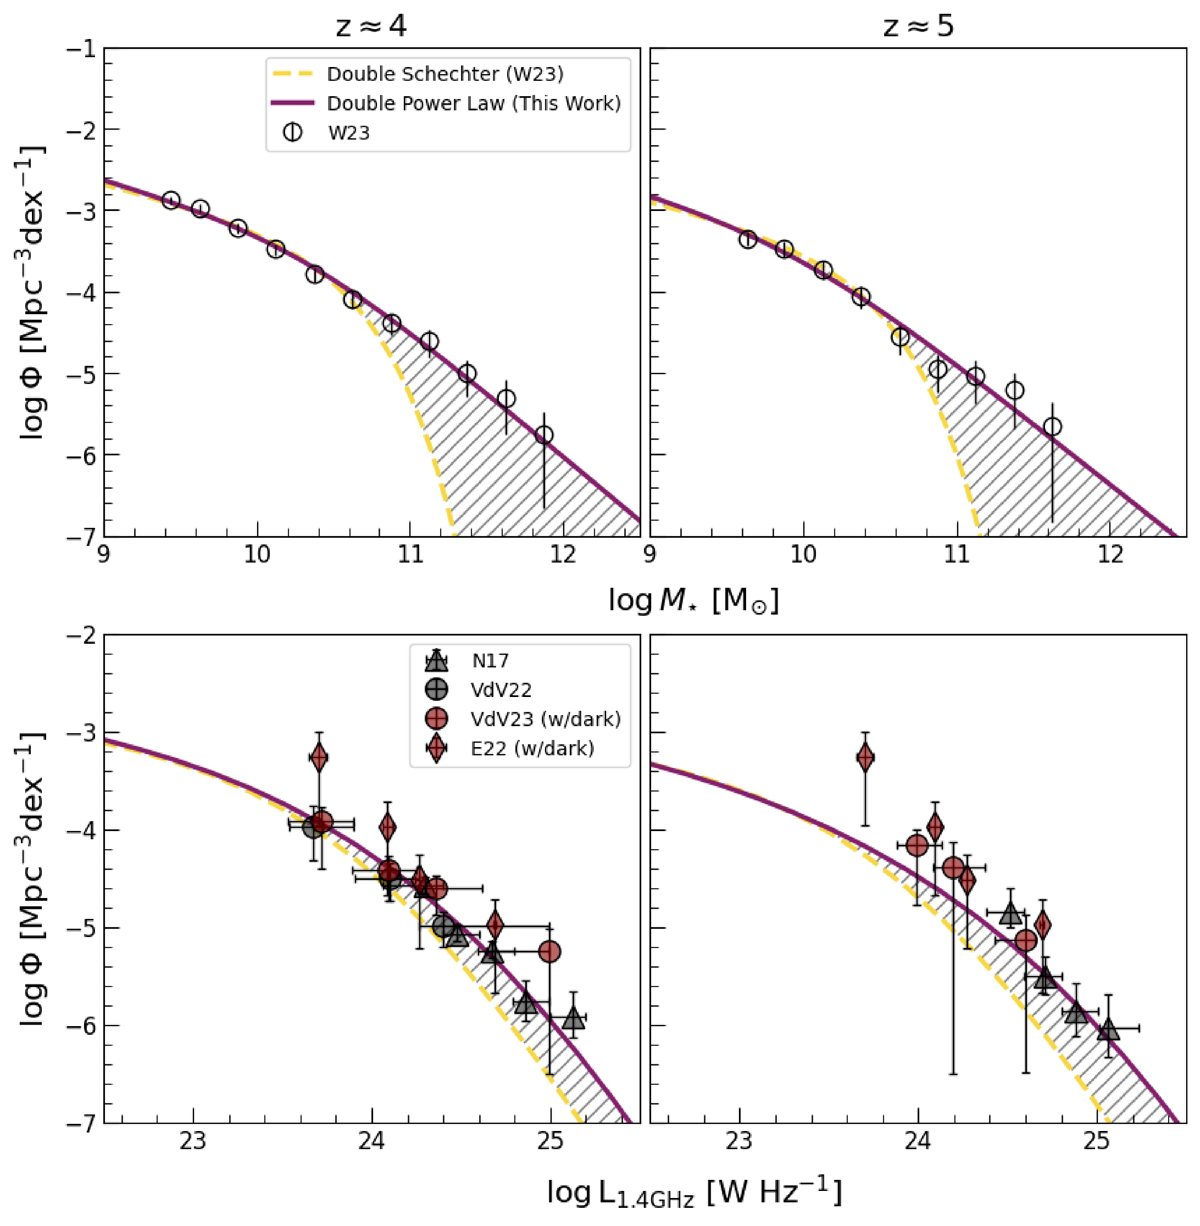
This figure summarises the results presented in Sect. 4.2. The two top panels show the SMFs for the highest redshift bins discussed in this paper. The bottom panels show the LF at 1.4 GHz derived from our model in the same redshift bins. The yellow dashed and purple solid lines respectively indicate the predictions obtained when adopting a Double Schechter Function (W23) and a Double Power Law (this paper) for the SMFs fitting. The hatched grey area highlights the difference between the two curves. Data points are the same as in Fig. A.2 for the SMFs and Fig. 2 for the LFs, highlighting in red samples which include dark galaxies.
Current usage metrics show cumulative count of Article Views (full-text article views including HTML views, PDF and ePub downloads, according to the available data) and Abstracts Views on Vision4Press platform.
Data correspond to usage on the plateform after 2015. The current usage metrics is available 48-96 hours after online publication and is updated daily on week days.
Initial download of the metrics may take a while.