Fig. 2.
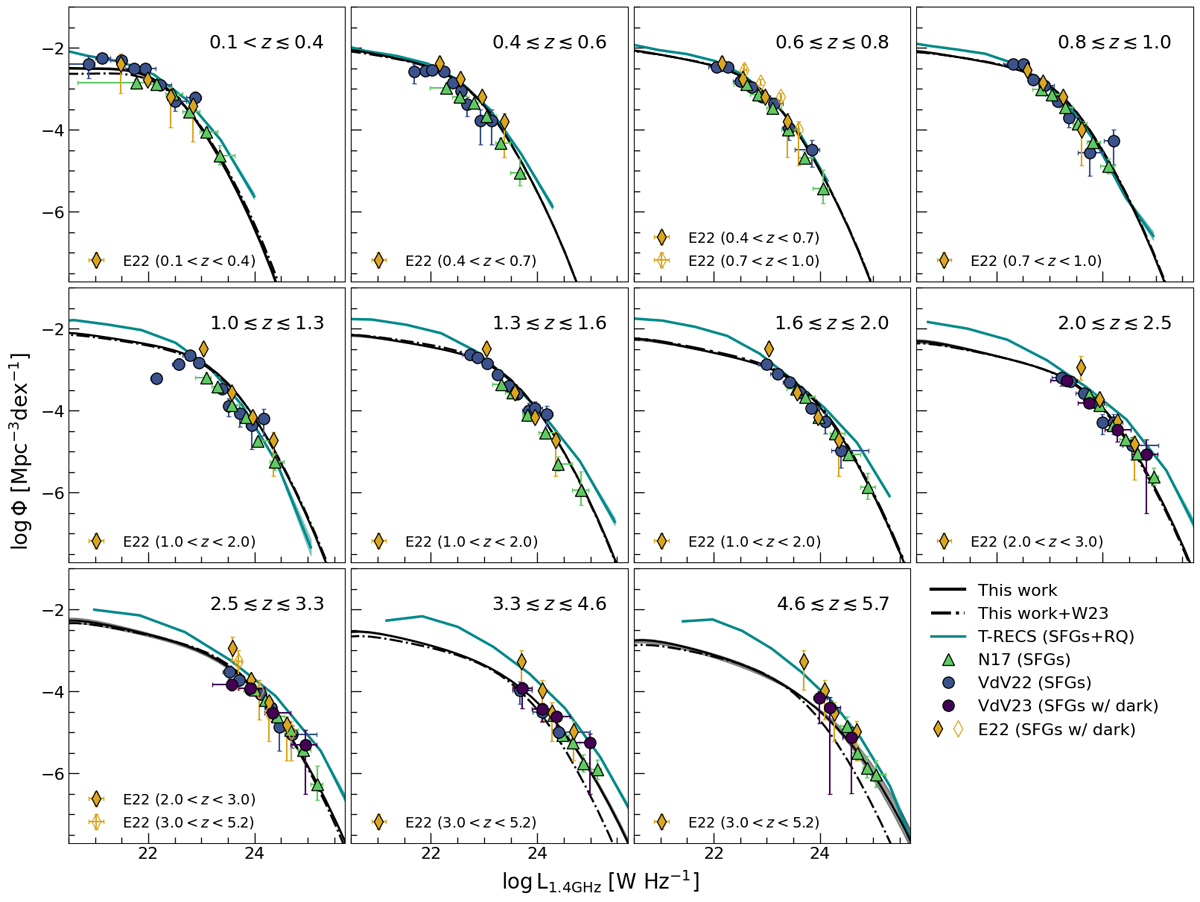
Download original image
1.4 GHz LF for SFGs for different redshift bins (black solid lines) predicted by SEMPER adopting the Delvecchio et al. (2021) relation. Dot-dashed lines show how our model would change when considering the SMFs derived by W23 with a Double Schechter form. Eq. (11) is applied only for the first redshift bin. Data are from Novak et al. (2017), Enia et al. (2022), and van der Vlugt et al. (2022, 2023). Enia et al. (2022) and van der Vlugt et al. (2023) data include the contribution of ‘dark’ sources. The cyan lines and shaded areas are the predictions from the T-RECS simulation by Bonaldi et al. (2019, 2023) and the respective 1σ uncertainties. Note that data from Enia et al. (2022) spans redshift bins not matching the ones adopted by our model and shown in each panel’s legend.
Current usage metrics show cumulative count of Article Views (full-text article views including HTML views, PDF and ePub downloads, according to the available data) and Abstracts Views on Vision4Press platform.
Data correspond to usage on the plateform after 2015. The current usage metrics is available 48-96 hours after online publication and is updated daily on week days.
Initial download of the metrics may take a while.