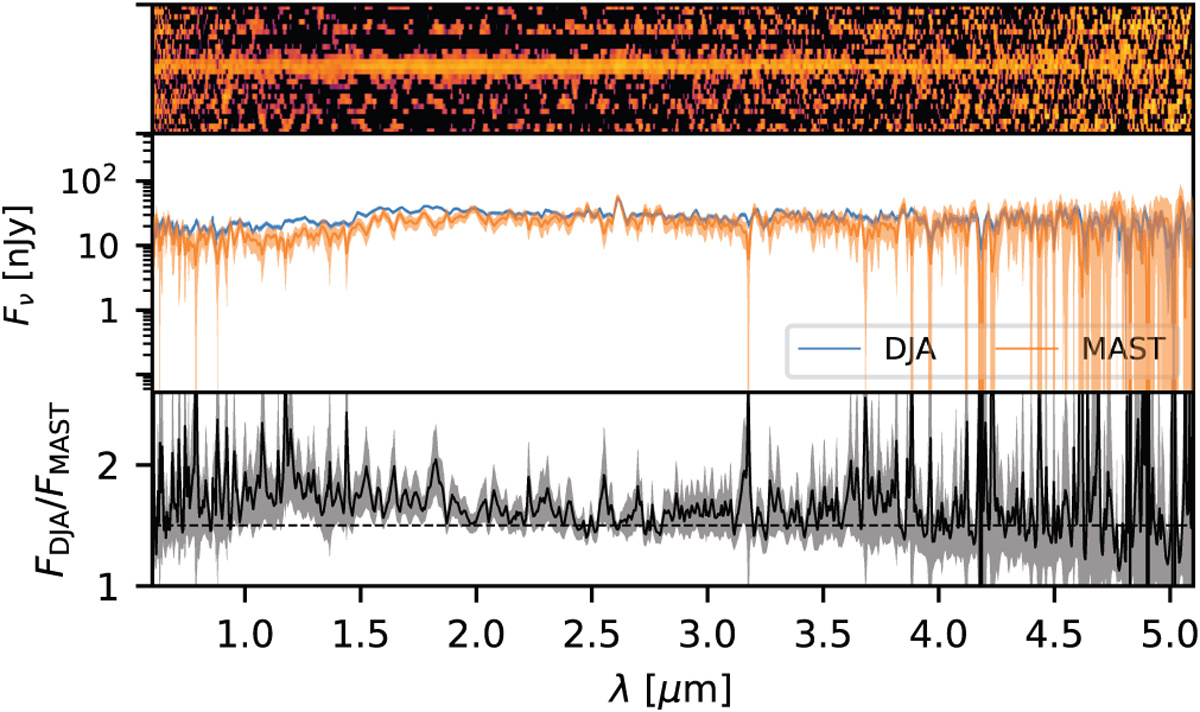
Fig. 2
Download original image
Example of reduction discrepancy between MAST and DJA reductions of JADES ID = 4413 (MAST NIRSpec ID). The object was selected arbitrarily as an example with typical rather than maximal reduction discrepancy. A stacked combination of available dispersers is shown (middle plot), along with the raw 2D Prism slit measurements (logarithmic color-scale, Fv, top plot). The ratio Fv, DJA/Fv,MAST is also color-dependent (bottom plot). The SEDs are sampled at R = 1000. Noteworthy discrepancies include the overall uncertainty difference, and a blue tendency in the DJA reduction as compared to MAST. Furthermore, feature differences around the 1-2 μm and 3-4 μm ranges are present. The reductions used here were collected from: D’Eugenio et al. (2025); Brammer (2023a).
Current usage metrics show cumulative count of Article Views (full-text article views including HTML views, PDF and ePub downloads, according to the available data) and Abstracts Views on Vision4Press platform.
Data correspond to usage on the plateform after 2015. The current usage metrics is available 48-96 hours after online publication and is updated daily on week days.
Initial download of the metrics may take a while.