Fig. 8.
Download original image
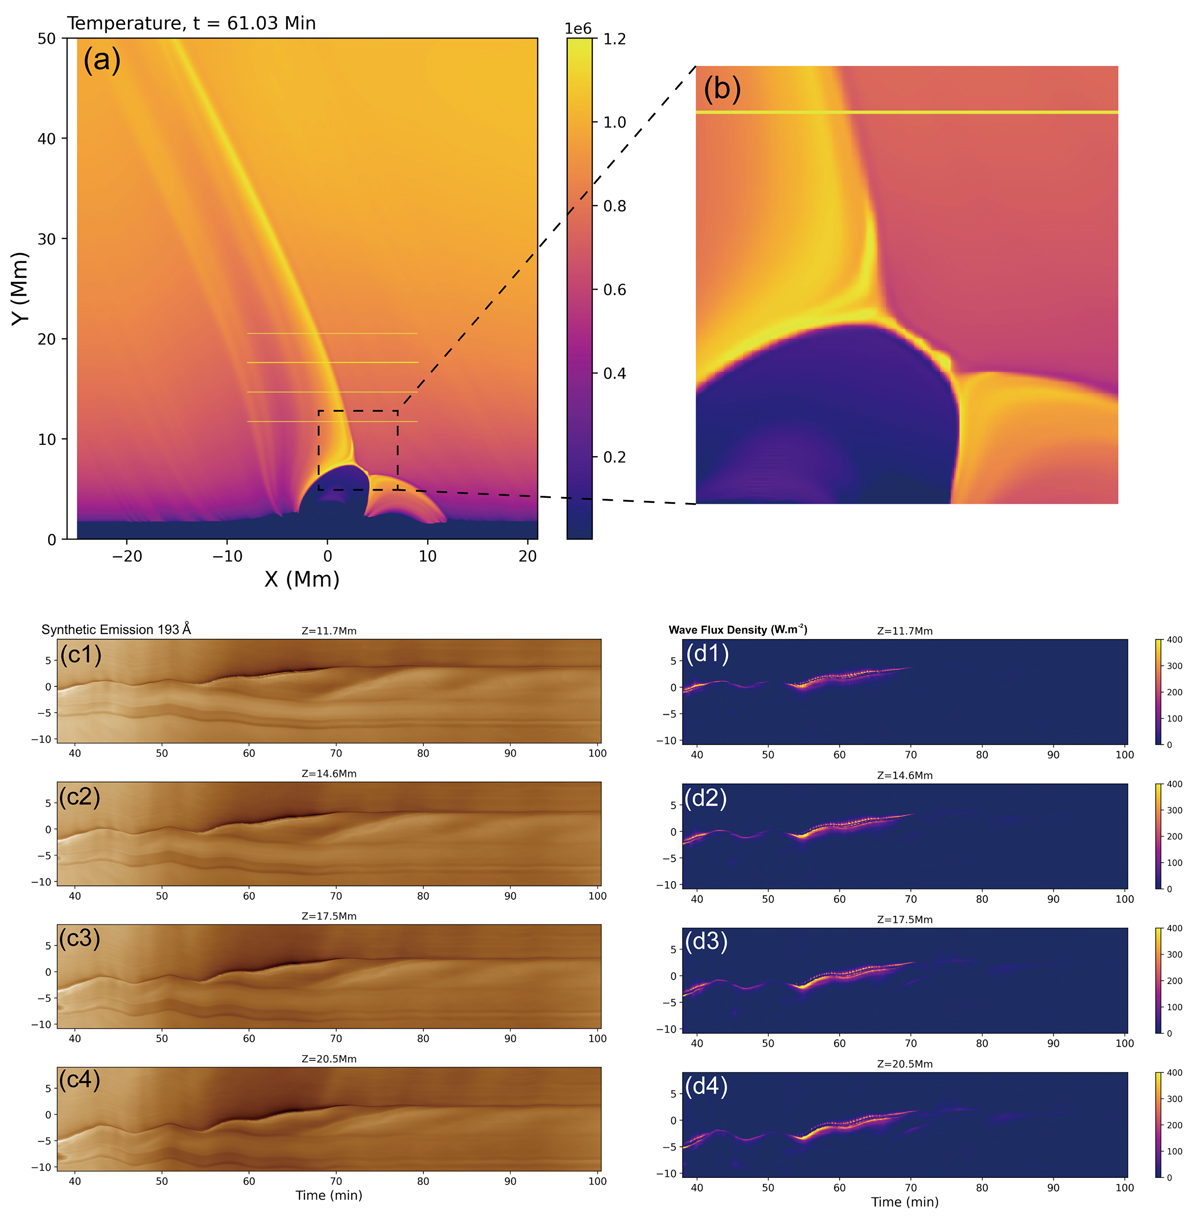
Upper left: Magnetic bipole at 61 minutes, approximately 10 minutes into the emergence phase. Four distinct horizontal slices are marked in yellow to indicate the regions where synthetic emission and Alfvén wave energy flux were calculated over time. Upper right: Zoom-in of the current sheet region, where the plasma blobs are clearly seen. Lower left: Time series of synthetic emission in the 193 Å wavelength for the four horizontal lines. Lower right: Alfvén wave energy flux density for the same four horizontal lines.
Current usage metrics show cumulative count of Article Views (full-text article views including HTML views, PDF and ePub downloads, according to the available data) and Abstracts Views on Vision4Press platform.
Data correspond to usage on the plateform after 2015. The current usage metrics is available 48-96 hours after online publication and is updated daily on week days.
Initial download of the metrics may take a while.