Open Access
Fig. 6.
Download original image
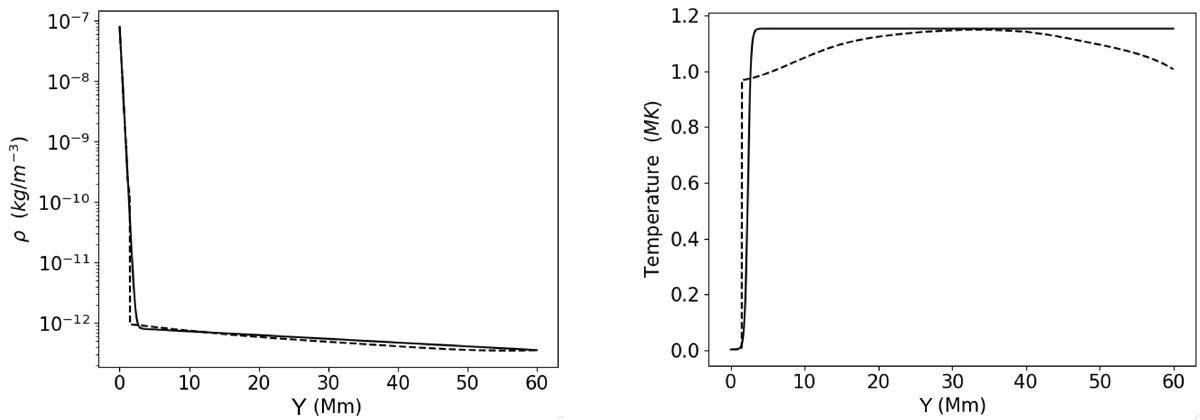
Plasma density, ρ (in kg/m−3; left) and plasma temperature, T (in MK; right), both as functions of height during the preparatory thermal relaxation phase at two different positions above the surface. Solid lines represent the initial state, and dashed lines the final state after the thermal relaxation phase.
Current usage metrics show cumulative count of Article Views (full-text article views including HTML views, PDF and ePub downloads, according to the available data) and Abstracts Views on Vision4Press platform.
Data correspond to usage on the plateform after 2015. The current usage metrics is available 48-96 hours after online publication and is updated daily on week days.
Initial download of the metrics may take a while.