Fig. 3.
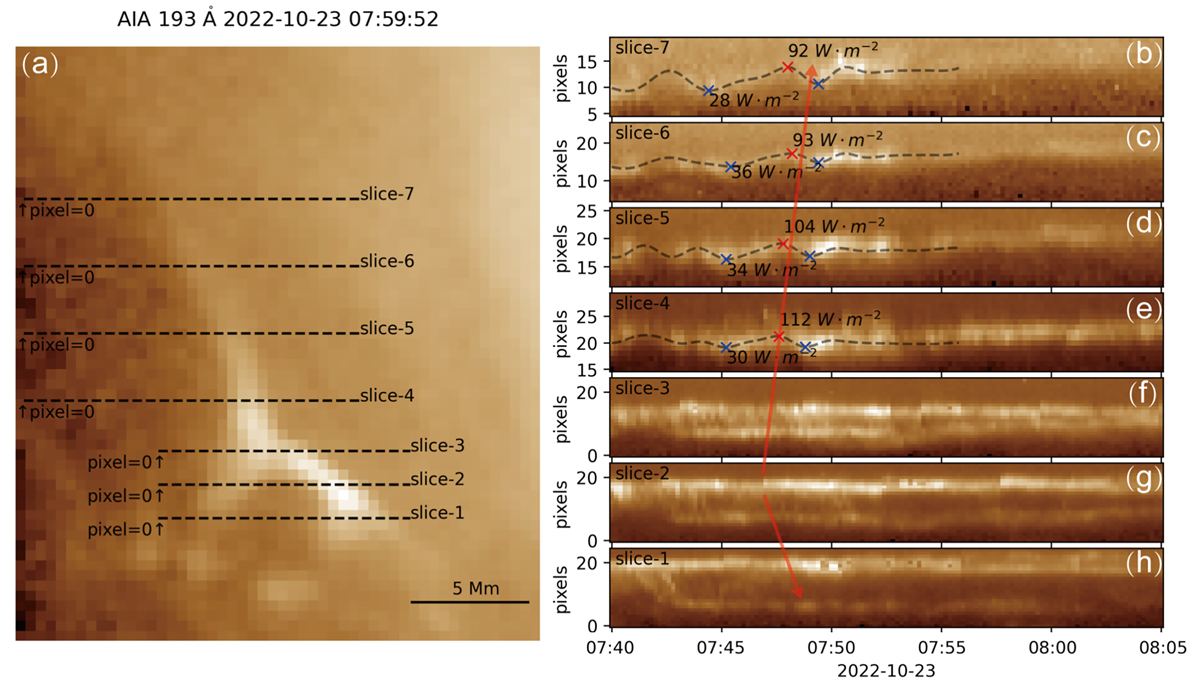
Download original image
Fine-scale activity and the outflowing fluctuations. (a) AIA 193 Å imaging, with black dashed lines marking the sampling path at multiple altitudes. (b)–(h) Sampling of AIA 193 Å imaging at corresponding altitudes, showing fine-scale activities such as plasma blobs, fluctuations, and jets within the reconnection event. Black arrows indicate the movement directions of plasma blobs and jets. Blue crosses represent wave troughs, and red crosses wave peaks.
Current usage metrics show cumulative count of Article Views (full-text article views including HTML views, PDF and ePub downloads, according to the available data) and Abstracts Views on Vision4Press platform.
Data correspond to usage on the plateform after 2015. The current usage metrics is available 48-96 hours after online publication and is updated daily on week days.
Initial download of the metrics may take a while.