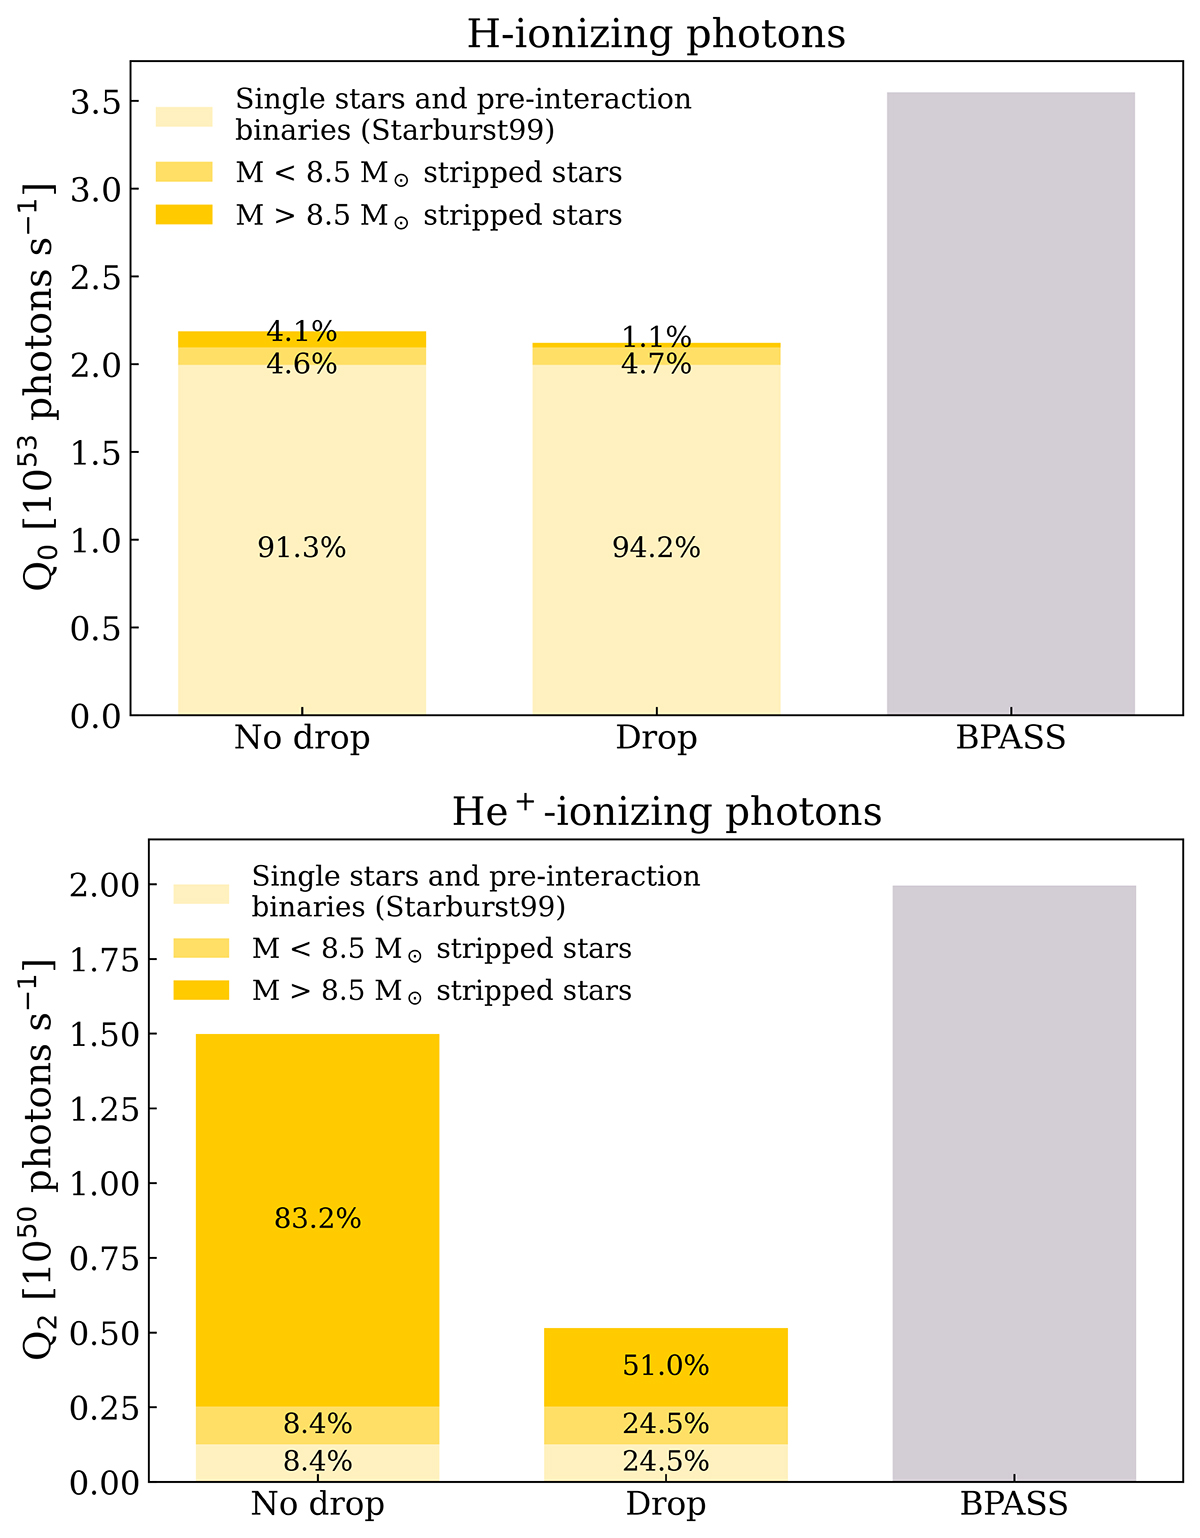
Fig. 8.
Download original image
Rough estimates for hydrogen- (Q0, top) and helium-ionizing (Q2, bottom) emission rates. The total rates are shown as a sum of rates for single stars, low-mass stripped stars whose rates are calculated via interpolation (M < 8.5 M⊙), and higher-mass stripped stars whose rates are calculated via extrapolation (M > 8.5 M⊙). We did this calculation separately in the case that there is no drop (left) and in the case that there is a drop (middle), and we show the estimate from BPASS for comparison (right).
Current usage metrics show cumulative count of Article Views (full-text article views including HTML views, PDF and ePub downloads, according to the available data) and Abstracts Views on Vision4Press platform.
Data correspond to usage on the plateform after 2015. The current usage metrics is available 48-96 hours after online publication and is updated daily on week days.
Initial download of the metrics may take a while.