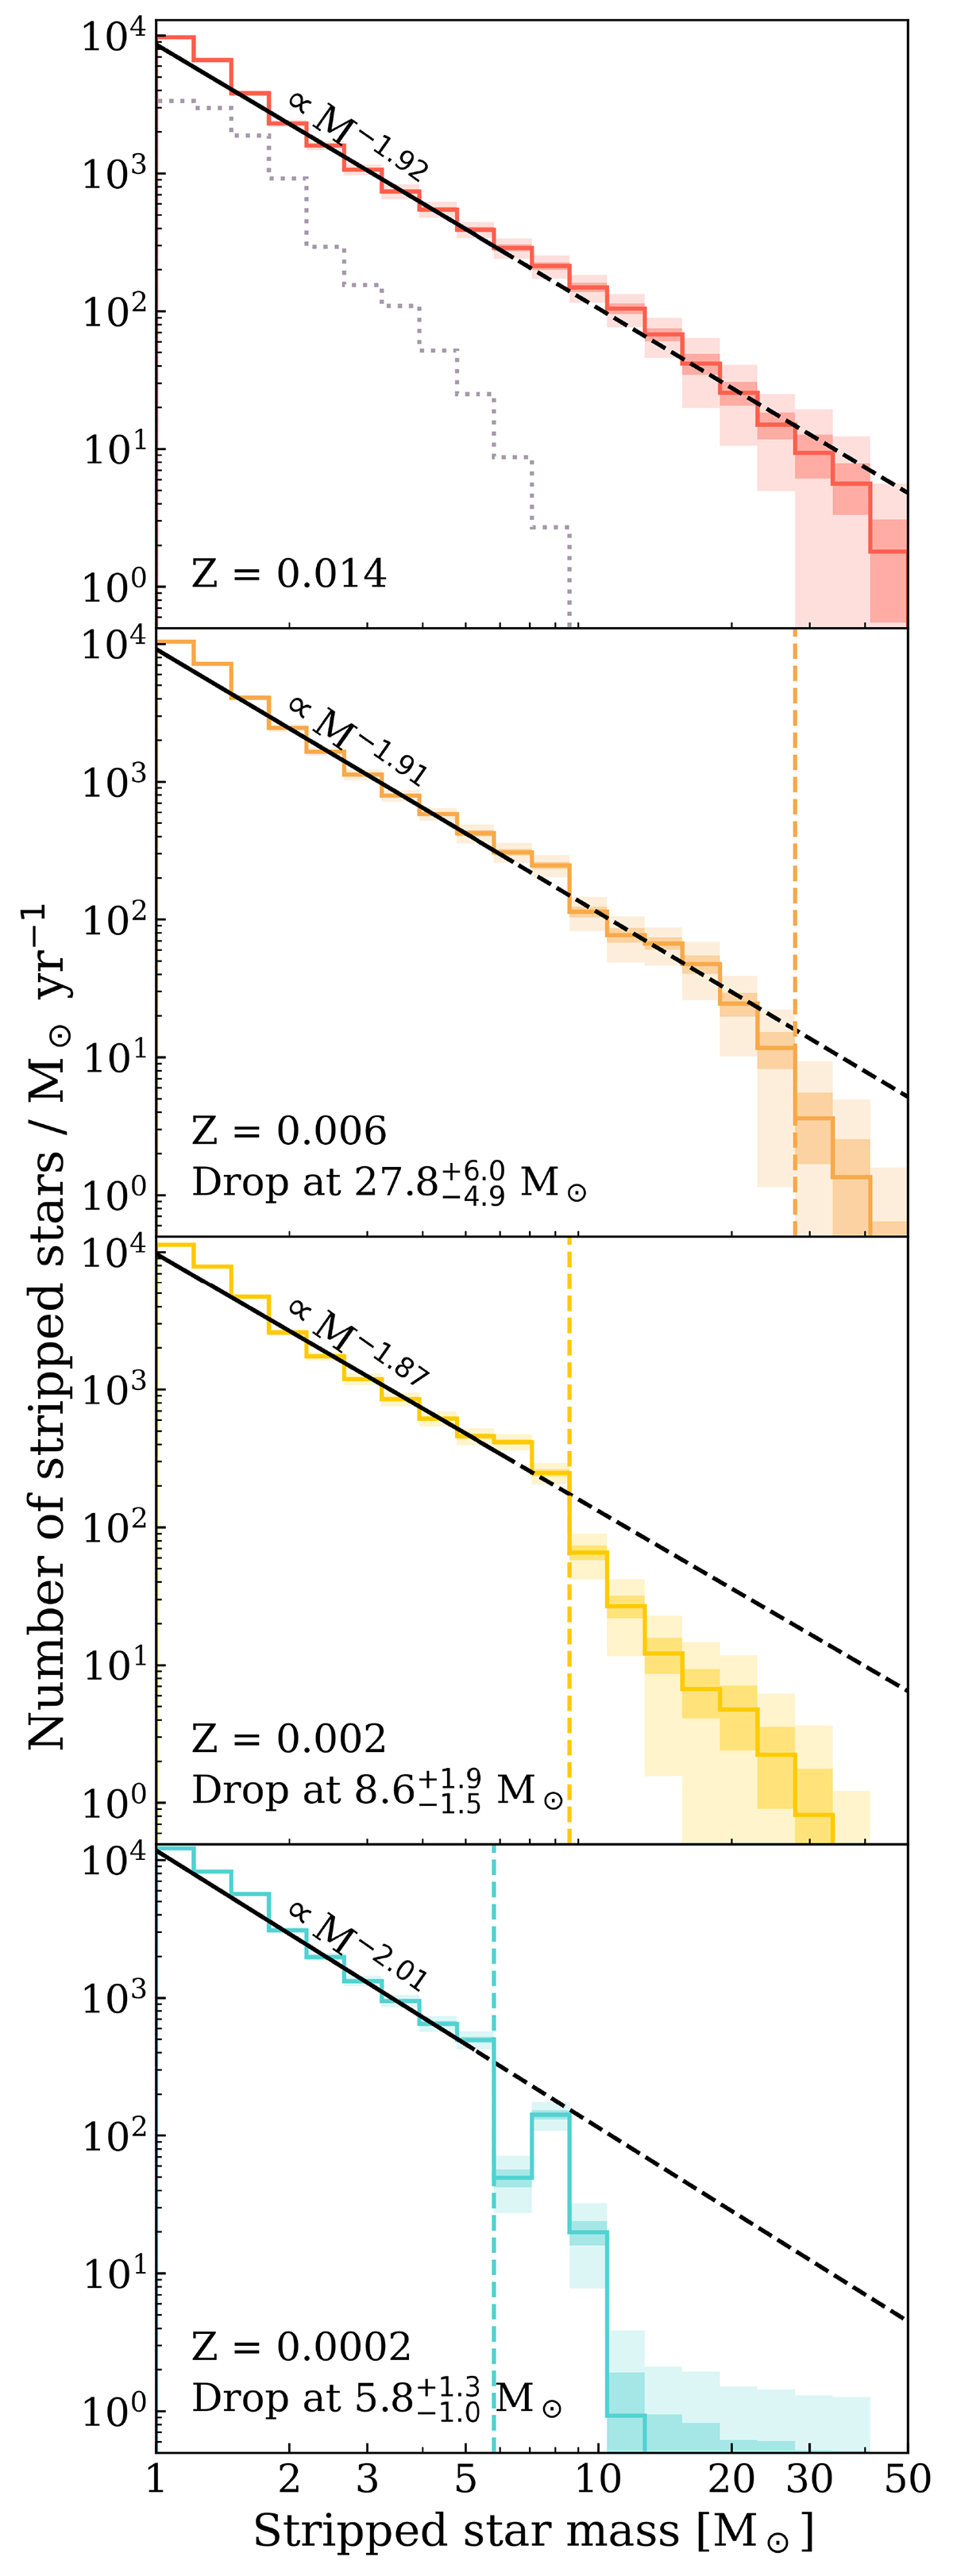
Fig. 4.
Download original image
Present-day mass function for hot stars stripped in binaries, adopting a constant star formation of 1 M⊙/yr. The solid, colored lines indicate the mean number of stripped stars expected within each mass bin from 100 model runs, and the shaded regions show 1 and 3σ above and below each line. The dashed black line was fit to the lower-mass end of each distribution, and the range of masses used for the fit is shown by the solid portion of the black line. The “drop” in each mass distribution is determined as the point where the upper 3σ line drops below the dashed line of best fit, and its uncertainty is taken to be the width of one mass bin in each direction. The gray dotted line in the solar metallicity plot shows the mass distribution from Yungelson et al. (2024).
Current usage metrics show cumulative count of Article Views (full-text article views including HTML views, PDF and ePub downloads, according to the available data) and Abstracts Views on Vision4Press platform.
Data correspond to usage on the plateform after 2015. The current usage metrics is available 48-96 hours after online publication and is updated daily on week days.
Initial download of the metrics may take a while.