Fig. 1.
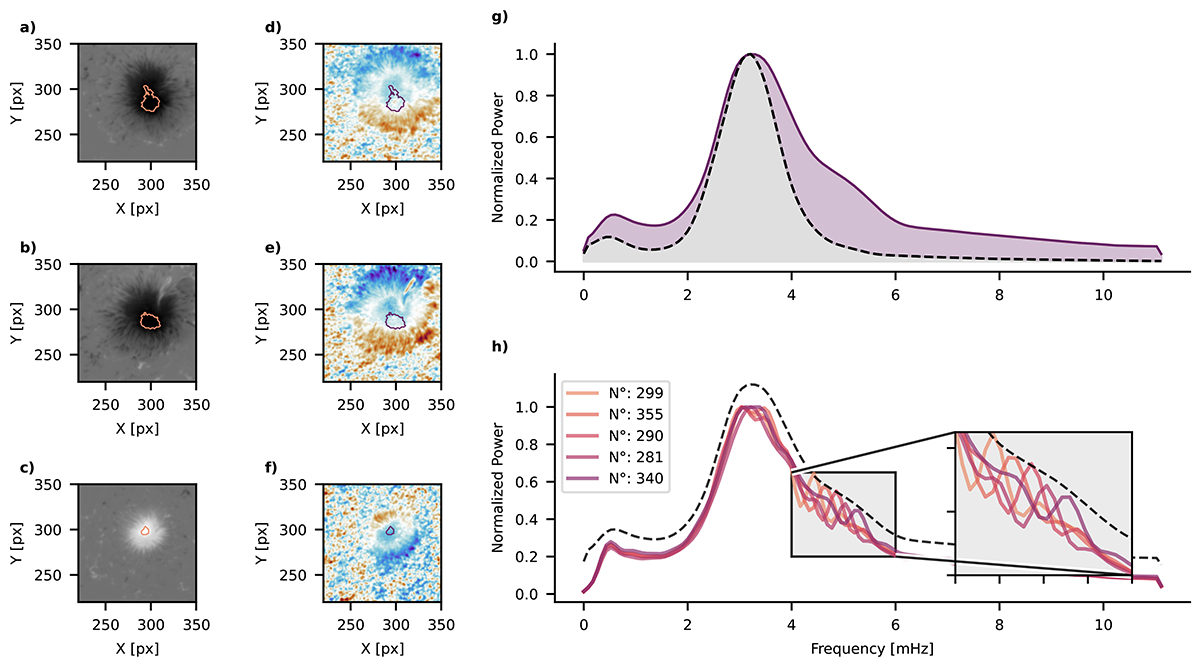
Download original image
Doppler velocity analysis of sunspots. a–c: Magnetograms of three randomly selected sunspots. The orange contours mark the region in which the magnetic field is above 1800 G, considered to be just about the umbra-penumbra boundary (Jurčák et al. 2018). All the magnetograms are saturated between –1800 G and 1800 G d–f: Corresponding Dopplergrams of the same sunspots. The violet contours indicate the umbral region, inherited by the magnetograms. g: Mean Doppler-velocity power spectrum for all sunspots (violet; solid line) and for quiet-Sun regions (grey; dashed line). h: Mean power spectrum of the sunspots classified by the positions of the frequency of their secondary peaks. Following the order in the legend, the classes are centred respectively at 4.3, 4.5, 4.7, 4.9, 5.1 mHz, with a width of 0.3 mHz. The number of sunspots per class is indicated in the legend. The black dashed line represents the mean power spectrum shown in violet in panel g, shifted upwards by 0.14 to aid visualisation.
Current usage metrics show cumulative count of Article Views (full-text article views including HTML views, PDF and ePub downloads, according to the available data) and Abstracts Views on Vision4Press platform.
Data correspond to usage on the plateform after 2015. The current usage metrics is available 48-96 hours after online publication and is updated daily on week days.
Initial download of the metrics may take a while.