Open Access
Fig. 4.
Download original image
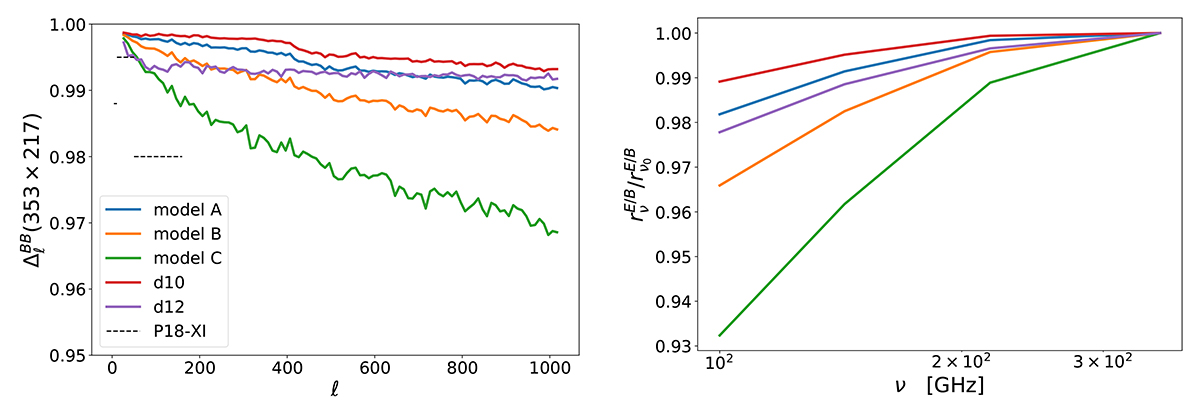
Comparison of the proxies of complexity, ![]() (left) and
(left) and ![]() (right), for the three proposed models (A, B, and C), d10 and d12. The black dashed lines in the left panel represent the lower limits on
(right), for the three proposed models (A, B, and C), d10 and d12. The black dashed lines in the left panel represent the lower limits on ![]() set by the analysis of Planck data and taken from Planck Collaboration XI (2020).
set by the analysis of Planck data and taken from Planck Collaboration XI (2020).
Current usage metrics show cumulative count of Article Views (full-text article views including HTML views, PDF and ePub downloads, according to the available data) and Abstracts Views on Vision4Press platform.
Data correspond to usage on the plateform after 2015. The current usage metrics is available 48-96 hours after online publication and is updated daily on week days.
Initial download of the metrics may take a while.