Open Access
Fig. 3.
Download original image
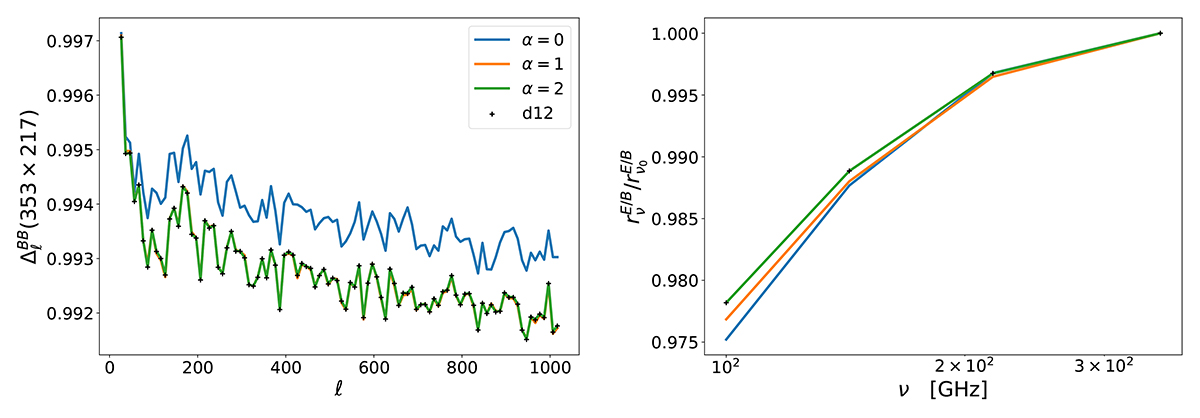
Two proxies of the dust complexity: decorrelation ![]() (left) and the E-to-B ratio rE/B (right). Values are plotted for the d12 original map (black crosses) and its representation by a pivot modified blackbody (blue), a moment expansion up to first order (orange) and up to second order (green).
(left) and the E-to-B ratio rE/B (right). Values are plotted for the d12 original map (black crosses) and its representation by a pivot modified blackbody (blue), a moment expansion up to first order (orange) and up to second order (green).
Current usage metrics show cumulative count of Article Views (full-text article views including HTML views, PDF and ePub downloads, according to the available data) and Abstracts Views on Vision4Press platform.
Data correspond to usage on the plateform after 2015. The current usage metrics is available 48-96 hours after online publication and is updated daily on week days.
Initial download of the metrics may take a while.